PlotMyPaws - Phase 1
A Dog Tracking Visualisation

This is Bryn, a 7-month-old, infinitely wild, working cocker spaniel, and for the past month, I have been mildly obsessed with tracking his movements.
I spend most of my days creating data-visualisations based on the movement of people and vehicles so it was only natural that as soon as Bryn came into the family I was googling GPS devices to attach to him. Seven months on and with some good puppy training instilled I was ready to track him.
Being a working cocker he is quite loyal in his movements, he will stick quite close to me or my wife and constantly seeks reassurance before venturing off. Whilst this is interesting in its own right it doesn’t make for a particularly interesting visualisation. However, Bryn has recently discovered a neighbouring cornfield and with a nod from the local farmer, he began exploring.
For the first few walks, he would disappear for a couple of minutes at a time into the maize which prompted me to get a tracker for him so I could see where he was exploring. At the time I only had a Garmin Forerunner 235 watch which I was a bit nervous about attaching to him, something I would later learn to regret! Needless to say, I fixed it onto his harness and off he went, the below is the first foray into #plotmypaws!
So, admittedly it is flawed, my track is a recorded track from a previous day so doesn’t really play correctly to where I was in relation to Bryn. However, it is interesting to see Bryn’s patterns deviating in the cornfield (the easterly field), he becomes braver and his movements are far more erratic.
What’s the next most logical evolution of #plotmypaws? Mapping his movements over 1 week!
Bryn gets walked twice a day, early morning and with the heat at the moment, late at night. On each walk, I attached my Garmin to him and started tracking him. As my Garmin is linked up to my Strava account it has been quite funny watching him get ‘Personal Bests’ for fastest mile etc, the Garmin even tried to record his heart rate for a ‘Suffer Score’ but not quite sure how it’s tracking that!

After every walk I download the GPX from Strava, bring it into QGIS to anonymise my origin (something I forgot to do at first!) and give each track a unique ID. After I export the GPX points to .csv I’m able to plug the data into our in-house ‘Design Suite’ to create the motion trails.
The process went smoothly until Bryn appeared without my watch on his harness! My pretty pricey Garmin watch was now sitting somewhere in the below…

Retracing my steps seemed impossible seen as Bryn had no real pattern to where he could go, but there was one glimmer of hope, my phone is linked via Bluetooth to my watch so when they are in close proximity they sync up! I ended up walking very slowly around that field for a good hour until it synced and then I was able to find it — thank god for connectivity!
Obviously I decided to purchase a cheaper tracker, and ended up with the Renkforce GT-730FL-S GPS Data Logger.

Don’t be fooled by the user reviews, most are complaining about the packaged software and not the quality of the device. Generally, it’s pretty good, my Garmin watch sampled at around 5-second intervals, the Renkforce can sample at 1 sec intervals. Although sampling at such a high rate can expose its GPS inaccuracy a little more than the Garmin. It has 2.5m CEP accuracy which is ok, especially for what I am doing, and better than the Forerunner which is pretty inaccurate (http://fellrnr.com/wiki/Garmin_235#GPS_Accuracy). It also acquires satellites almost instantaneously and, until now, I haven’t had any noticeable dropouts.
So 1 week and 14 walks later I was able to produce this:
Extrapolating my walk distance puts me around 35km over 14 walks, Bryn almost doubles this at 67km. It’s not only beautiful to watch but is also pretty interesting to see that he has favourite areas he likes to explore, the heat of the trails shows notable patterns in the North and North-West corners of the maize field. You can also see linear patterns when he deviates from the path — this is him running down the rows of corn.

Now, the below is fundamentally flawed in that I am just using one sample for each so it’s not fair to derive any meaningful relationships from the visualisation.
However, it forms the basis of what could be a really great visualisation if I (and my wife!) persist in dual-recording our walks every day. That said, what if there are fundamental differences between the time of day we walk him? My wife can only walk him in the evenings so what if he is generally more active in the evening than in the mornings? There are obviously many factors that we would need to take into consideration but for the time being, I am just treating it as a bit of fun.
The visualisation should be straightforward, I designed a little viz element that bridges the two tracks with a dynamic circular buffer and connecting bridge. It shows how far Bryn deviates from both me and my wife at any point during the walk. This is then transposed into a graph so you can see how that looks in terms of time vs distance. Whilst he deviates a lot more during the ‘corn-field’ part of the walk he always doubles back and returns to each one of us, which is typical spaniel behaviour. Whilst he seems to run off further from my wife the max distance he ever goes from either of us is pretty much identical!
I may have spoken too soon, yesterday morning Bryn decided he didn’t want to respond to my whistle and calls and about halfway through the walk we lost each other. It’s tricky to see in the above GIF but the only reason I return is that my wife called me telling me Bryn had come home! It looks like we just missed each other at one point. Fortunately, there are no main roads but it was enough to make me want to put some sort of beacon on him!
I’ve loved tracking Bryn over the past month and whilst I think I am going to call an end to the Plotmypaws series (for a little while anyway). I do think there is more analysis/visualisation that can be done here…

PlotMyPaws - Phase 2
A Bigger Dog Tracking Visualisation
Bryn was the real star of ‘Phase 1’ and it certainly got my creative juices flowing for a larger, more ambitious project. There were many holes in the analytics of Phase 1 — it was largely just a bit of fun, however I couldn’t help but think how the project could evolve with a wider selection of dogs and breeds.
Thanks to the lovely folk of my village and a mini ‘Facebook marketing campaign’ calling for help I have been able to scale up the tracking quite significantly.Myself (and my team of tracking enthusiasts) have currently tracked 12 dogs and their owners. I have spent more time trying to comprehend the mindset of a dog whilst they are out walking than anything else lately, and have some really interesting findings including another escape attempt! Whilst Phase 2 is still ongoing I have been busy generating more data visualisations and have evolved the style somewhat from Phase 1.
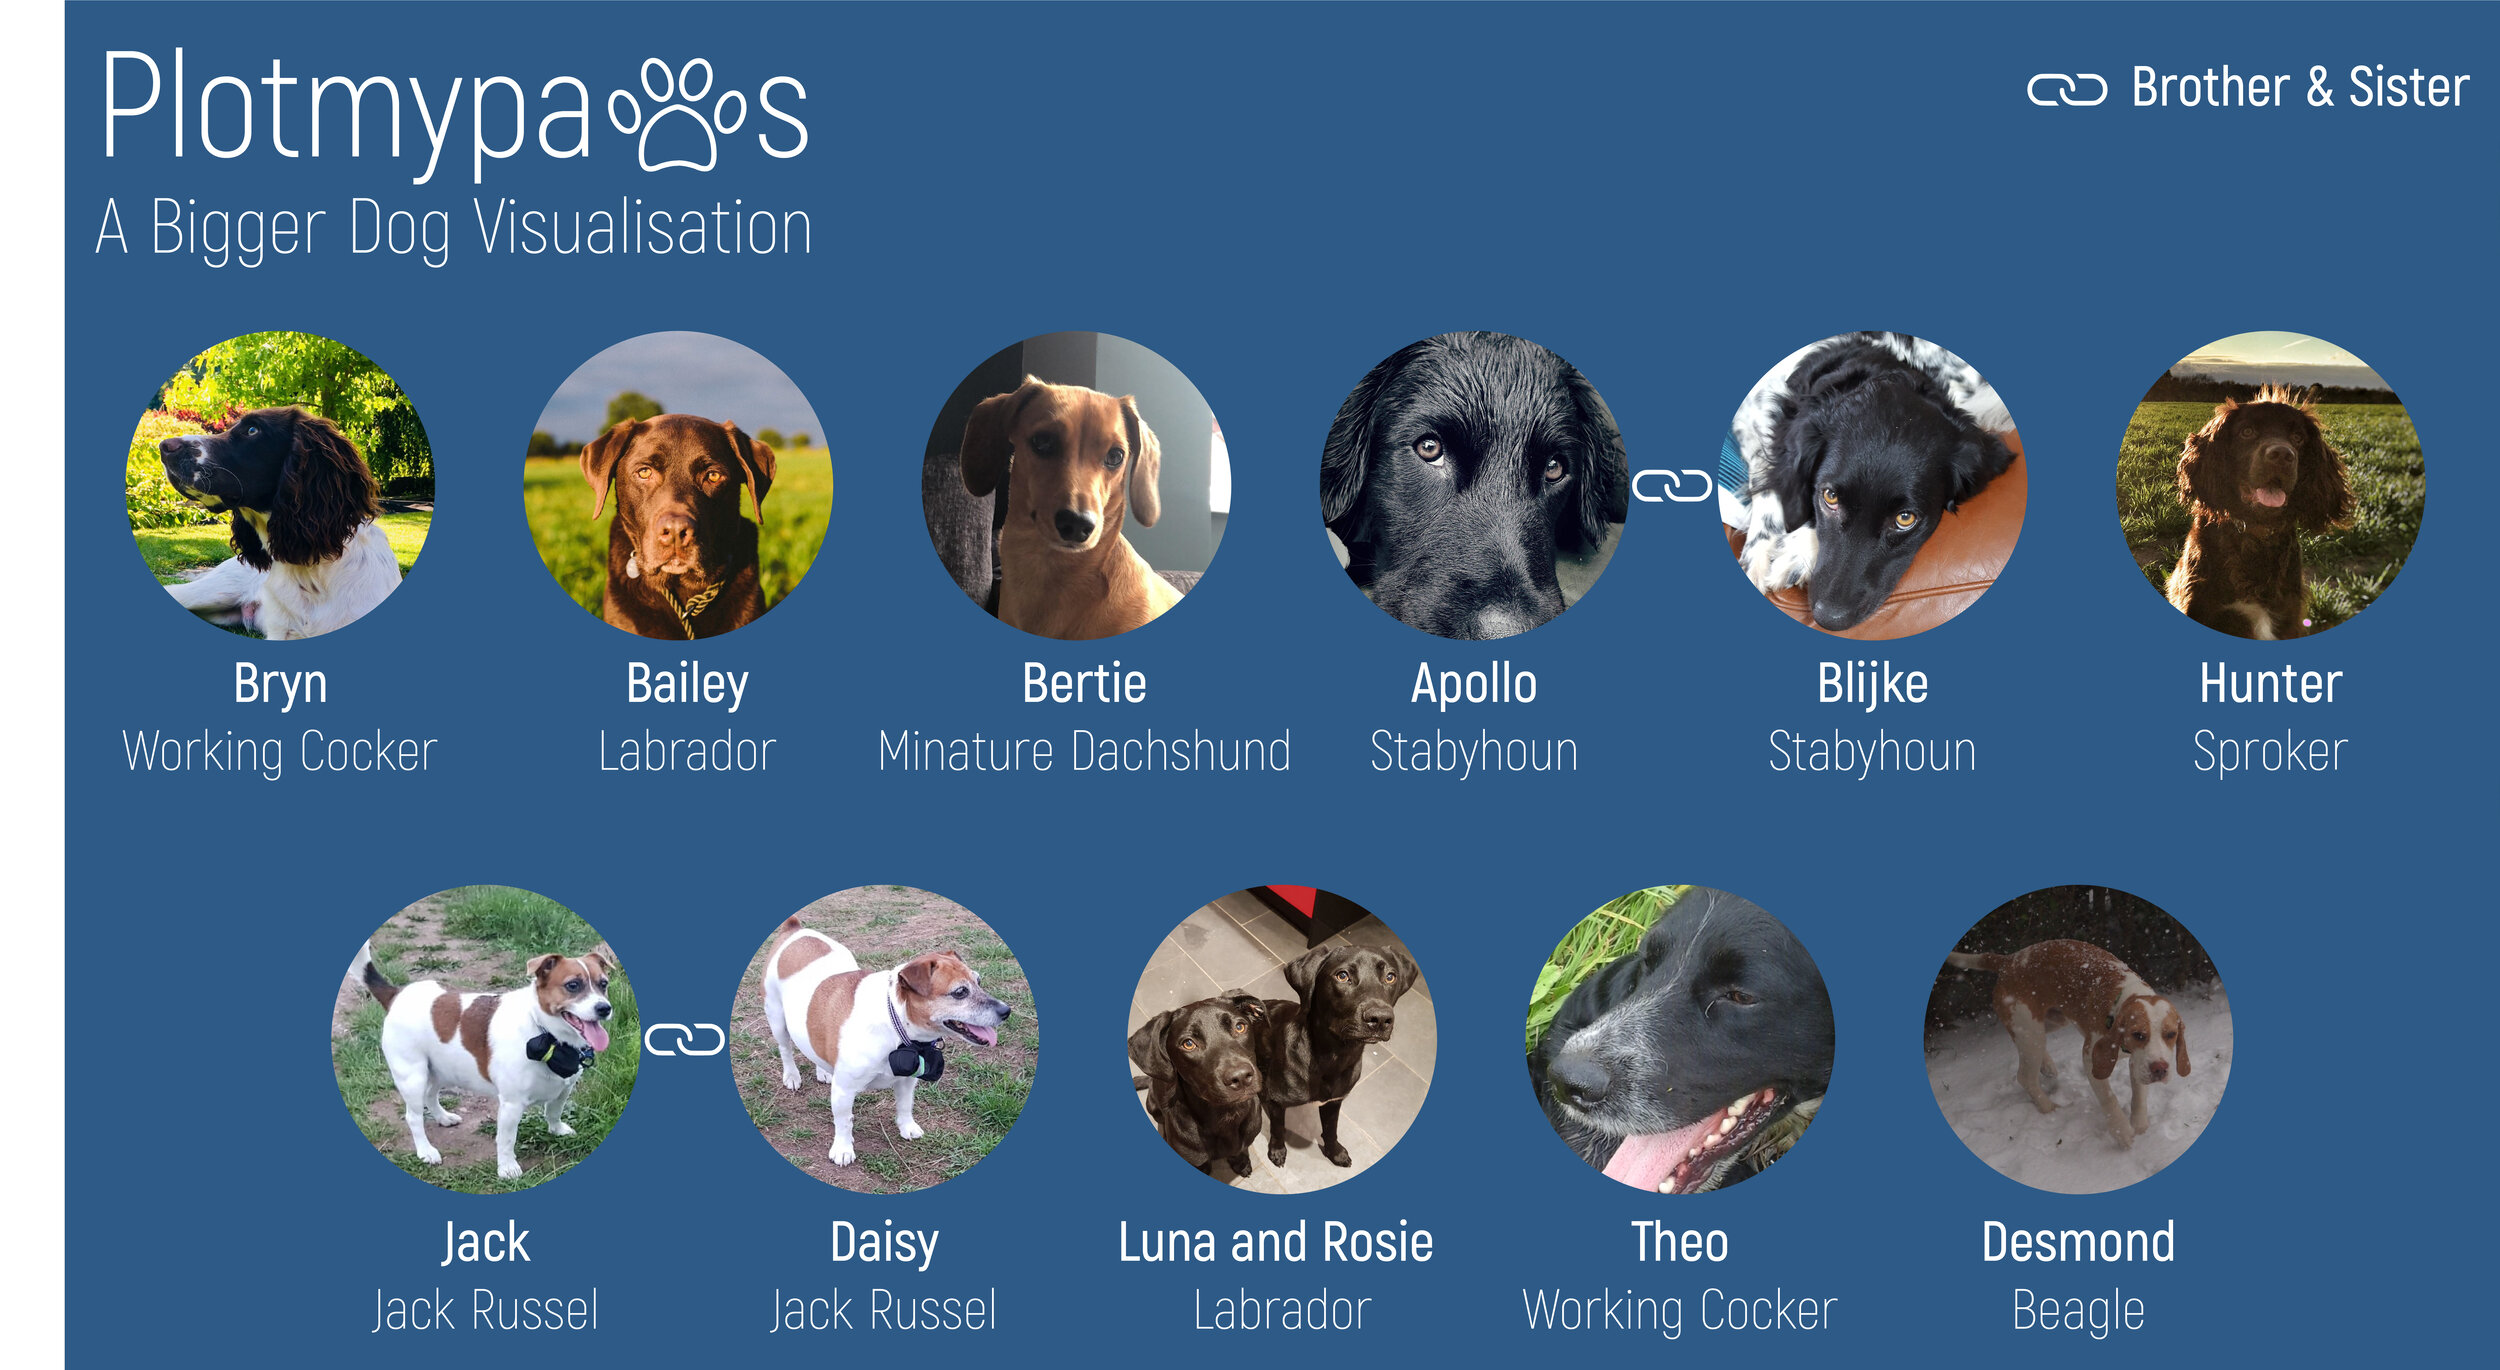
First of all let me introduce you to the new starts of PlotMyPaws Phase 2:
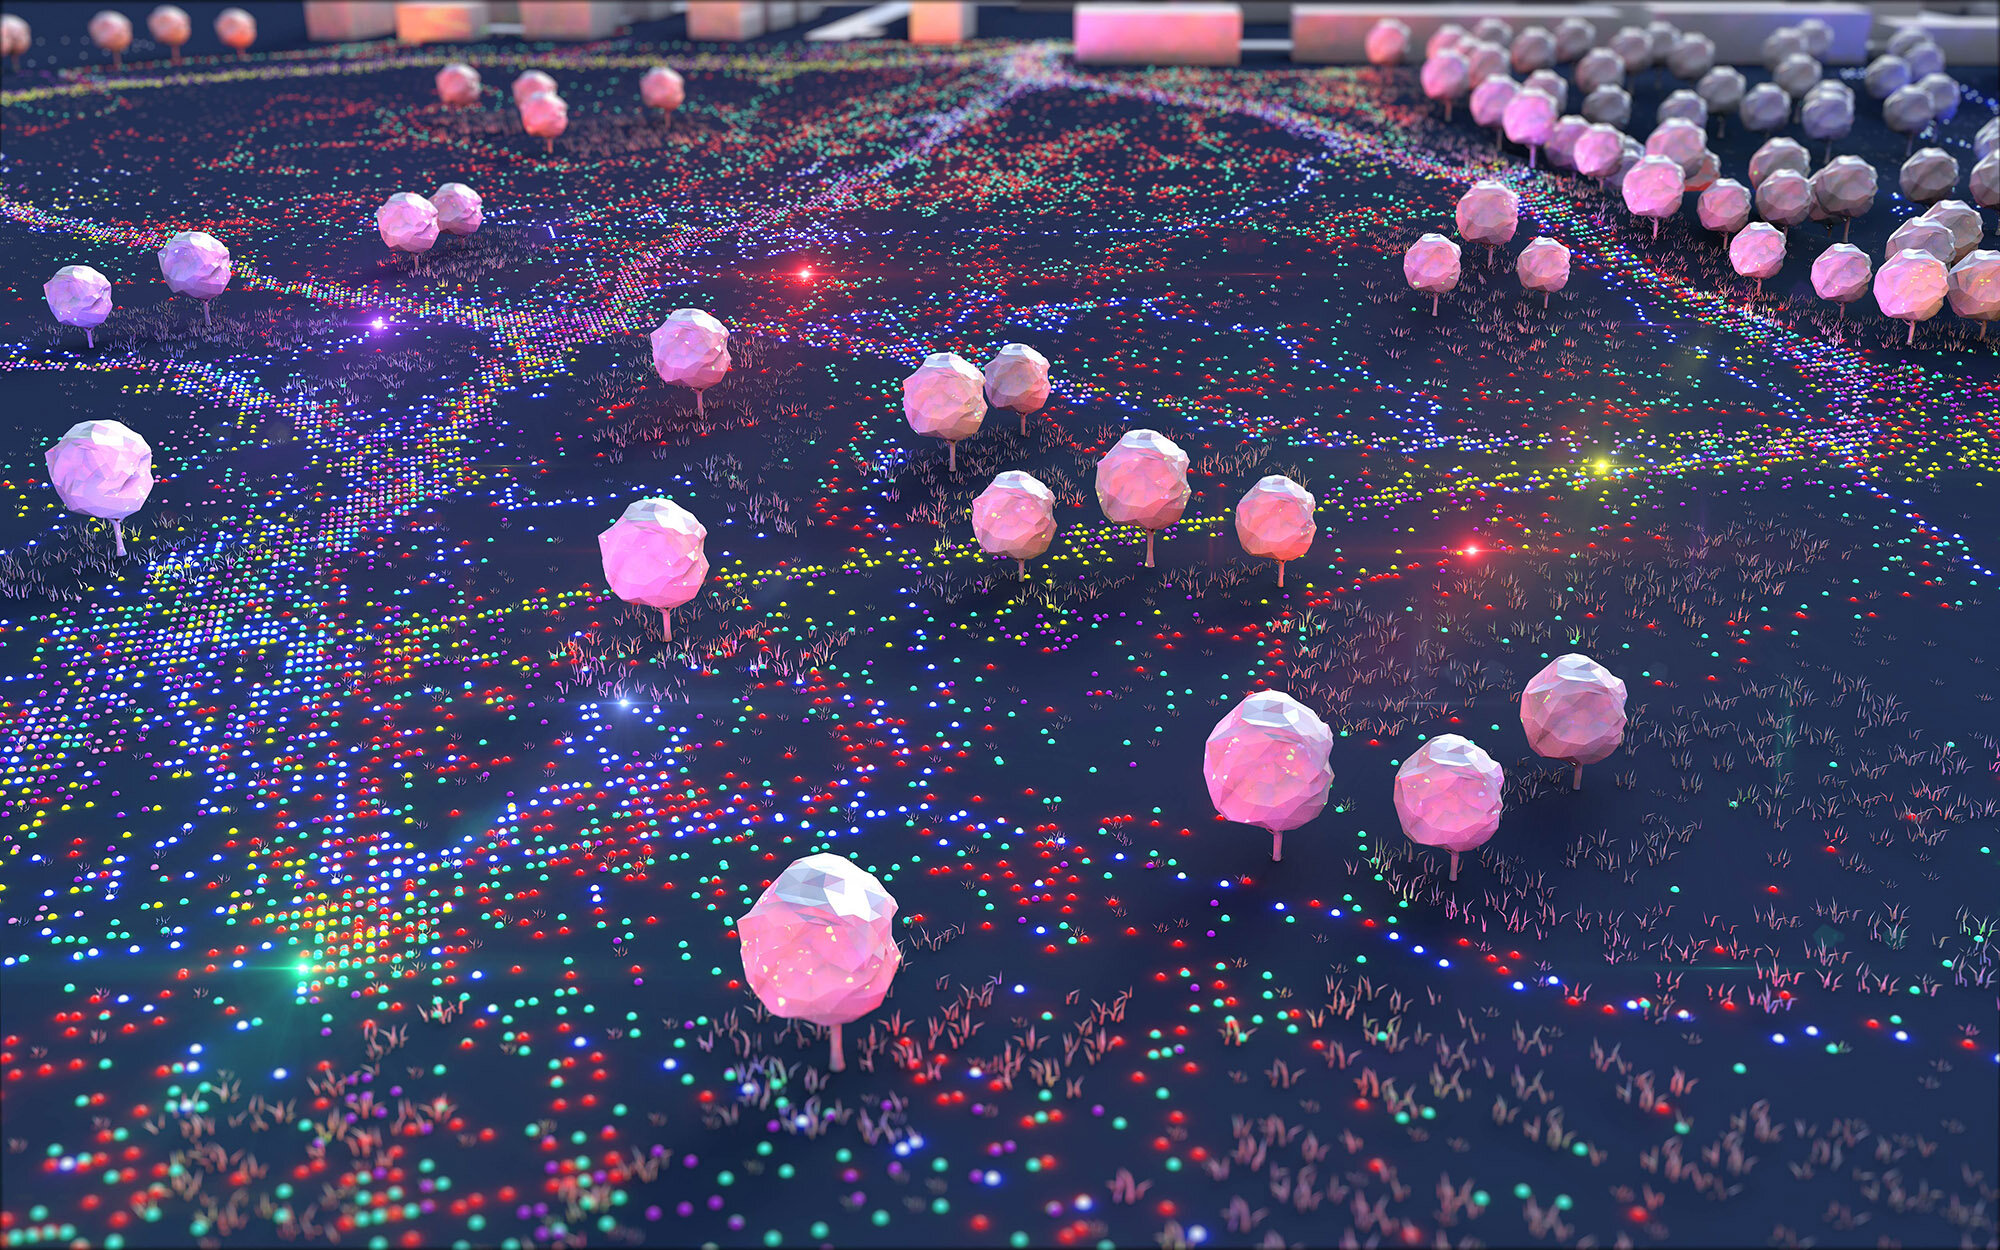
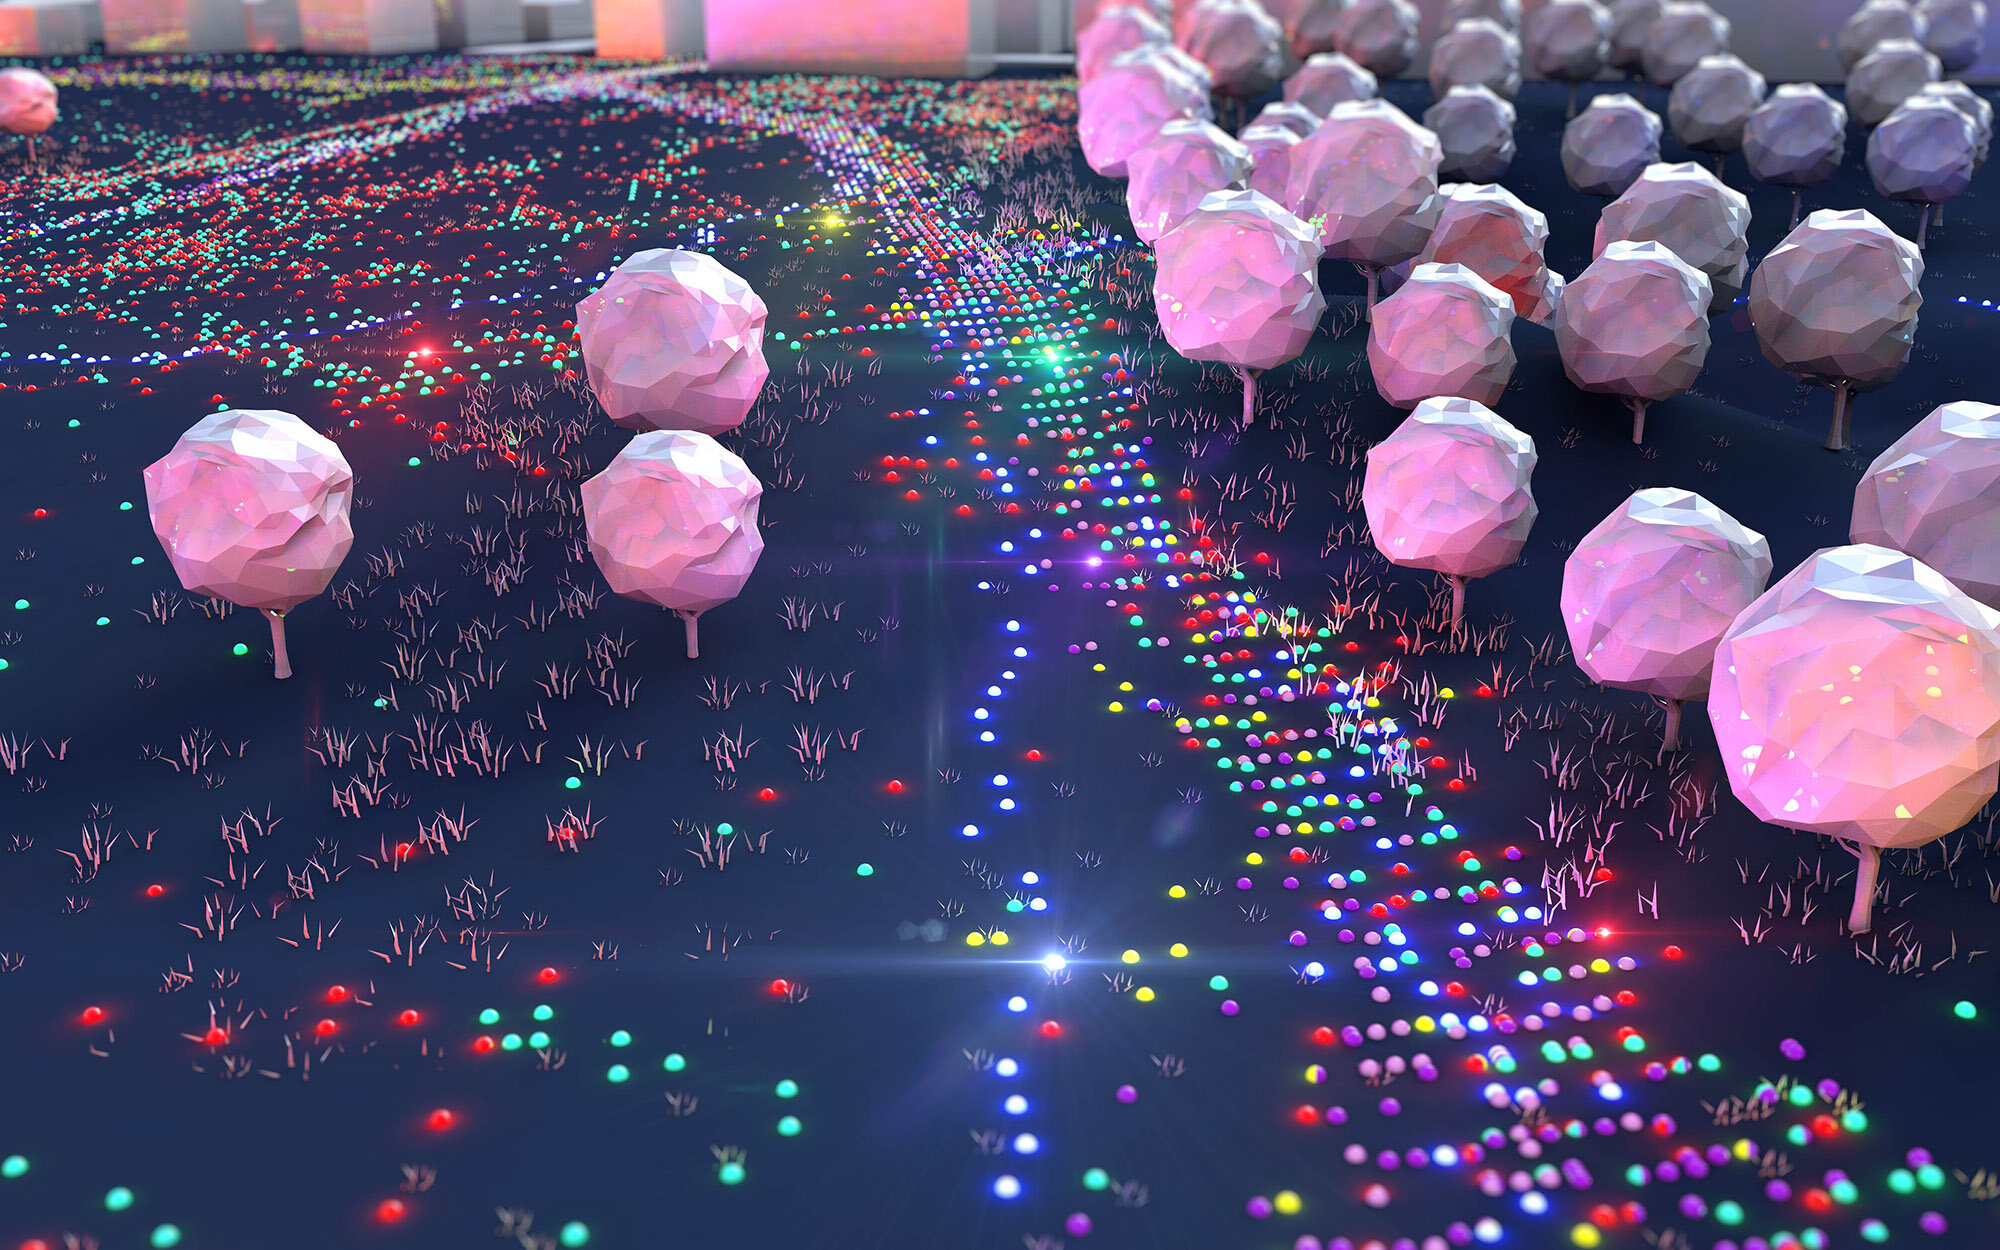
Each owner and their dog were given a tracker (same model as in Phase 1) and asked to record 6–7 walks throughout the week. Fortunately all of the trackers were returned, a testament to some ingenious on-collar engineering involved a modified treat bag and some carabiners! Now for the cool stuff, lets take a look at the ‘dance’ of all 12 dogs throughout their respective weeks…
There are some fascinating insights to be gleaned from this data, there are significantly popular tracks in the conservation area highlighted by the accumulating light trails, there is also a lot of ‘adventuring’, but which dogs are showing patterns? Which dogs are just running wild? To find the answers we need to dig a little deeper. Part of Phase 2 includes individual Plotmypaws stories, a collection of (in-depth?) analysis pertaining to an individual dog or breed. So far I have produced a few of these insight stories which are visualised below…
PlotMyPaws Story 1: Sibling Insight
Apollo and Blijke’s owners had a specific interest in the comparison between the siblings. The girl, Blijke, is far more loyal in the sense that she doesn’t stray too far whereas the boy, Apollo, frequently roams away from the owner. Both dogs are walked at the same time and the video below illustrates some deeper insight into this pattern.
PlotMyPaws Story 2: Desmond Escapes
The really great thing about the trackers is that when something out of the ordinary happens it’s recorded! Once in a while dogs have minds of their own and decide to ‘escape’! Meet Desmond the Beagle who decided to leave his owner and have an adventure of his own and find a friend! Thank goodness for vigilant village folk returning him to the local vets…
PlotMyPaws Story 3: Where is the pattern?
The final Plotmypaws story revolves around two young labrador pups. When I first processed the tracks I found it fascinating how random the tracks were. The visualisation below shows the tracks over 6 days and with some distance analysis for both labs at once. Note the erratic nature of the graphs, those dogs are enjoying themselves!
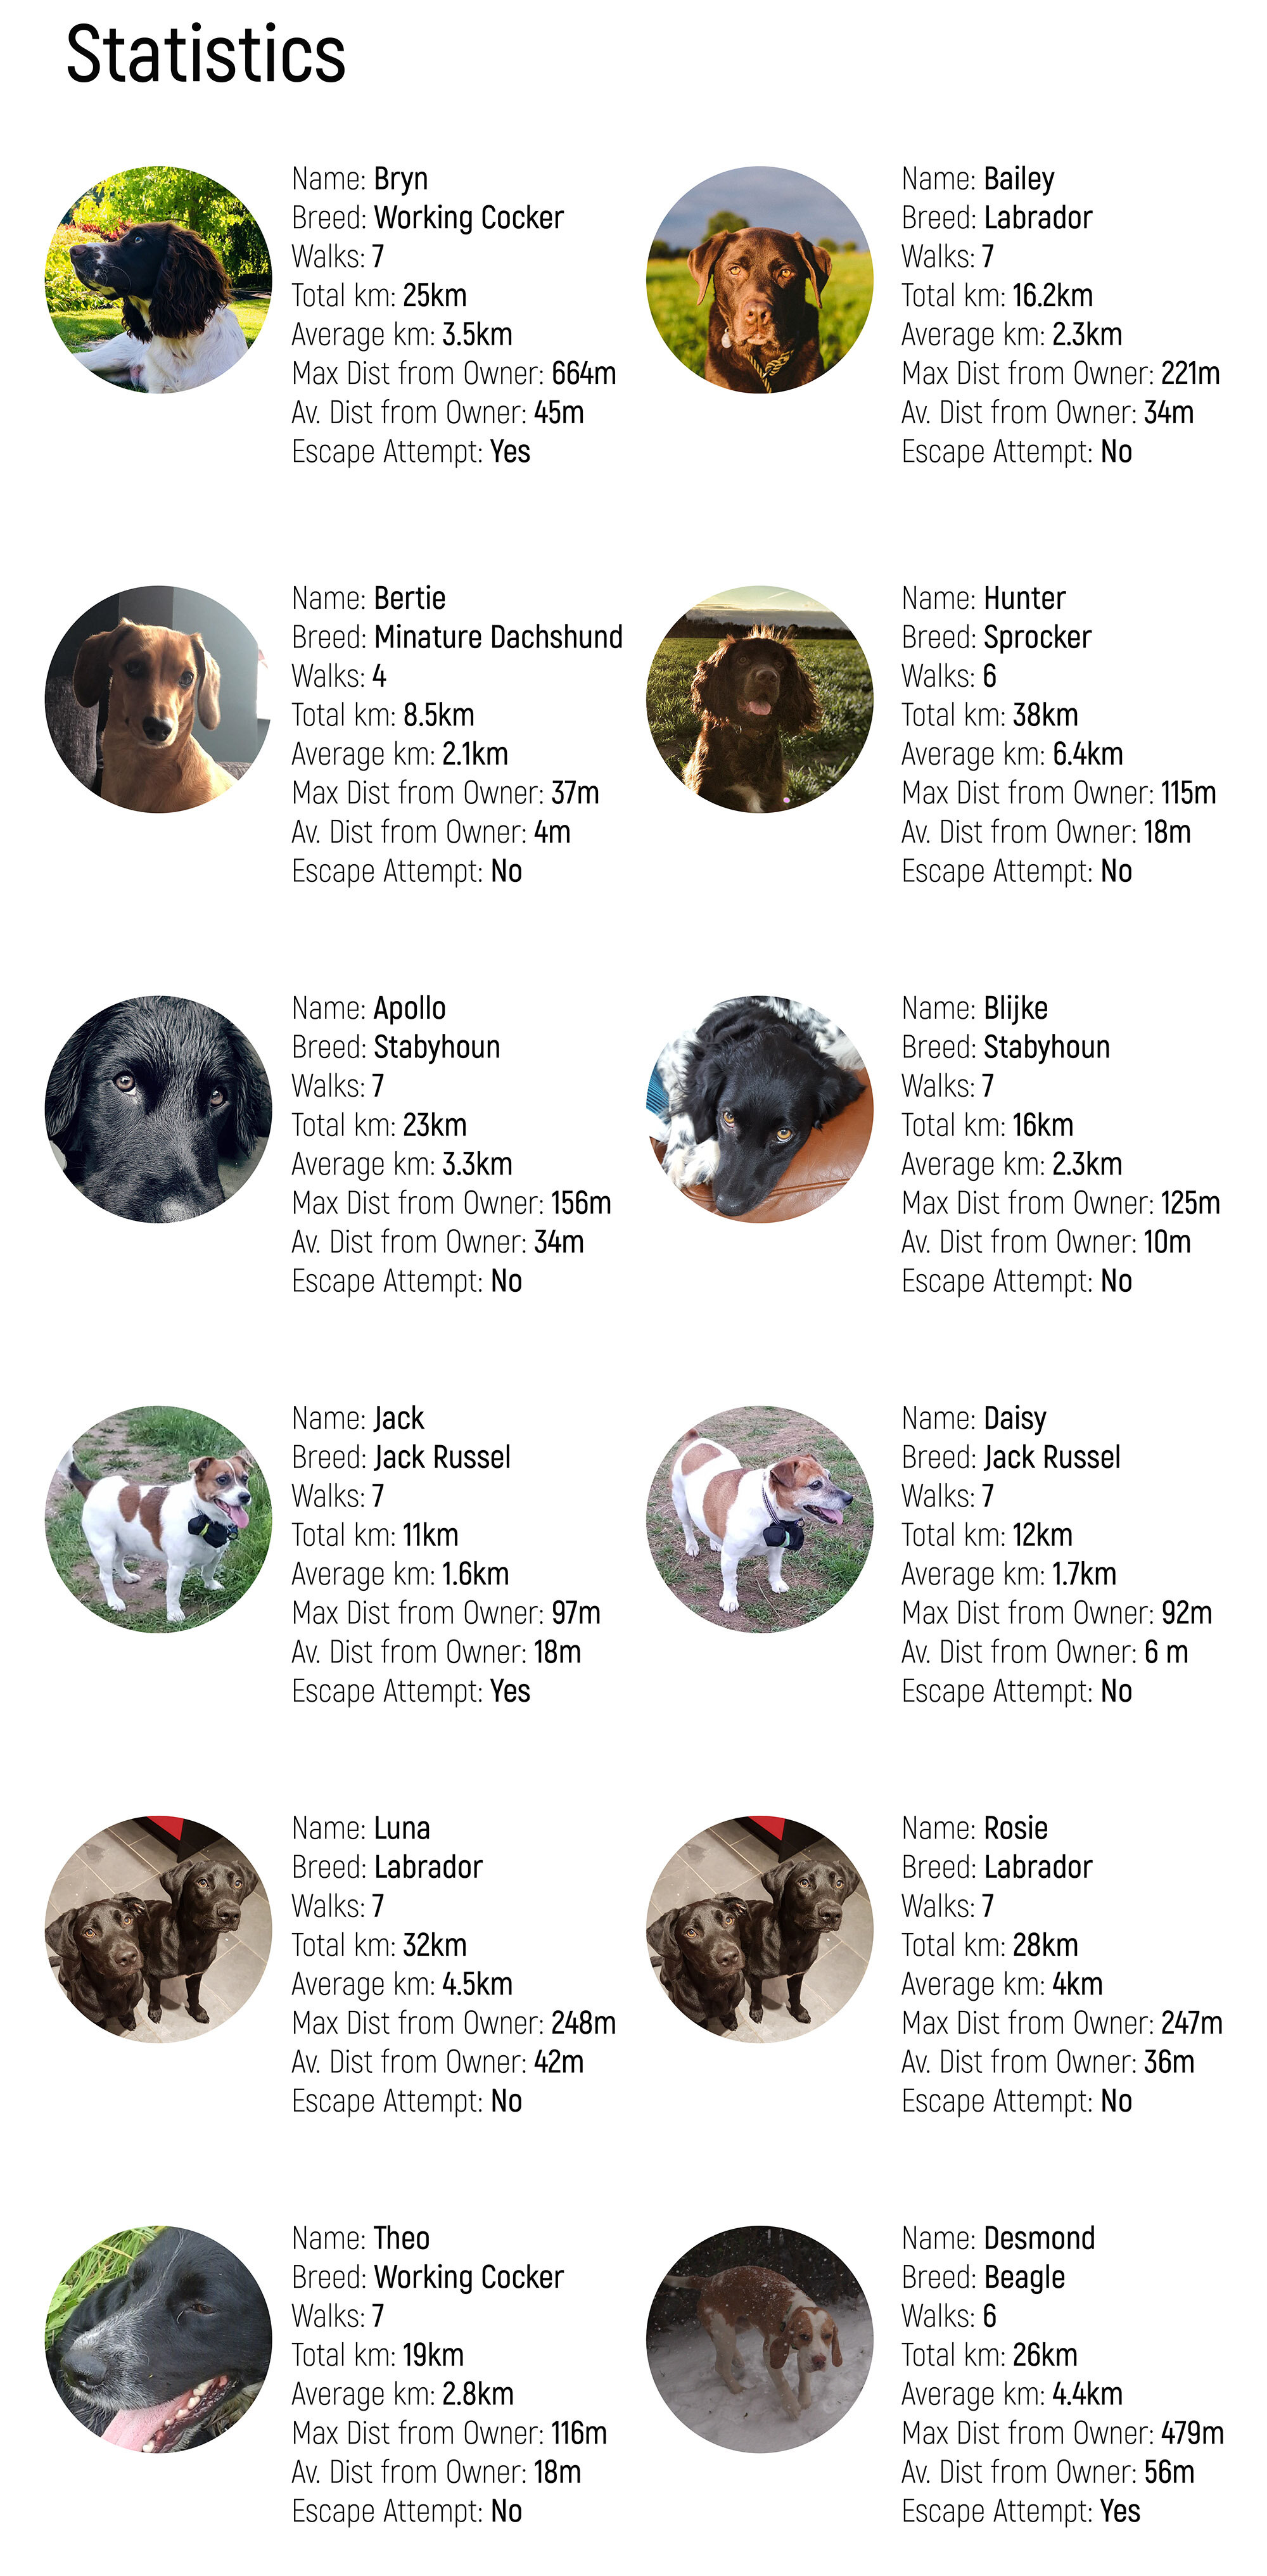
Statistics
Now let’s look at some statistics for all of the dogs throughout their tracking.
In addition to the above statistics I thought it would be cool to do some analysis into what percentage of a dogs walks lie in different distance bands(distance away from its owner). The below graphs illustrate this with the darker columns indicating time spent in large distance bands.


So there are some interesting patterns; comparatively Desmond and Bryn have higher percentages in larger distance bands which is the complete opposite to Bertie, Jack and Daisy who tend to stick closer to their owners for a larger portion of the walk. Looking back on Desmonds story it’s no surprise there is a spike in the 250m+ band as this would account for his little adventure to the vets!
Heatmaps
Heatmaps are still a concept I am refining but the initial concept for working out the heatmap is interesting so I thought I would share it. I was interested in creating a heatmap of deviation, the points at which the dog decided to deviate from the owner would have a higher value than where they were being obedient. So how to do this? My concept idea is illustrated below, it essentially revolves around 1) calculating the distance at every second of the walk 2) finding that linear paths mid-point 3) buffering the midpoint by half the line length 4)hex-binning any intersecting buffers to create a composite heatmap.

So I first needed to know for every second of the walk how far the dog was away from the owner. To do this I calculate a line between both the walker and dog and simply calculated the distance, the output looks like the below.

The next step was to buffer the mid point of that line in order to create some tangible geometry to make a heat map of sorts.

Now I had my buffers I simply needed to run some spatial joins in QGIS to count the number of times a sphere intersected the hexbin. The resultant count should represent areas where the dog deviates more — as there are more overlapping circles to count. The obvious issue with this is that directionality is thrown out of the window. The radius of the sphere suggests the dog could be anywhere in that sphere, so it’s slightly flawed (currently). However, the resulting heatmaps do show some interesting patterns…

Whats interesting about the heat-maps is that it is immediately clear where about in the walk the dog will decide to run off. Take Desmond, Rosie and Luna for example, this distribution isn’t as localised as Jack and Daisy indicating that they are likely to deviate at more locations throughout their walk. Apollo and Blijke is interesting because they both seem to deviate around similar points, incidentally both around inland water features! Theo’s is also interesting as he tends to deviate more during the initial part of his walk and settle down towards the end.
So lets now have a final look at a composite heatmap, this was simply made by summing all the individual hexbins.

I spent some time looking at the composite heatmap to try and make sense of it. Most of the annotations help explain the patterns we are seeing. Lets start with ‘Wide Open Areas’, these are areas in the conservation area which are unconstrained by vegetation and provide large running areas, there is also decent visability for ‘friend spotting!’ Interestingly enough around some of the heat spots are areas of inland water, I can’t speak on behalf of every dog but whenever I got for a walk with Bryn he b-lines for these areas. The wooded areas serve as constrained land and apart from Desmond most dogs tend not to venture into these areas due to the bramble/overgrown vegetation. We have more hard constraints in the form of fenced areas and a large escarpment which prevents dogs from wandering too far off. Lastly it’s interesting to see the heatmap peaking around some of the entrances, specifically the North-East entrance, it must be that mad burst of energy when they are initially released!
The Awards
At this point in the project, and given the number of dogs taking part, I thought what better way to celebrate a village collaboration than to have a prestigious Plotmypaws award ceremony. All awards are (mostly!) data-driven by the analysis I have sifted through so far, so without further ado….
Most Loyal Individual / Sibling
The award for the most loyal siblings goes to Jack and Daisy, two Jack Russel’s who are incredibly well behaved on their walks. With a max distance of < 100m deviation from their owner and an average of 10m over all their walks, they are truly deserving of the ‘most loyal’ title! However Bertie, the miniature Dachshund, wins the most loyal individual with a max distance of 37m and an average of 4m over all walks!
Most Erratic
Plotmypaws has been a real eye opener for me in discovering dog track patterns, most dogs tend to have their typical patterns i.e. Hunter and Bryn, although a bit crazy, will always return to the owner, a trait of the spaniel breed. However Rosie and Luna, two black Labrador pups are truely deserving of the title of ‘most erratic’ I can’t for the life of me find a pattern here!
Most Energetic
Hunter the Sproker wins this award, over a week of walks Hunter more than doubles his owners distance. Interestingly enough Hunter’s average deviation distance is about 18m, which is really low in comparison to other dogs (Desmond the Beagle averages 56m / Apollo the Stabyhoun averages 34m). It can only mean he is literally running circles around his owner!
Most Adventerous
The ‘most adventurous’ award uses the time a dog is more than 250m away from his/her owner as a proxy. No surprises here, Desmond the Beagle picks up this award, spending a total of 30 minutes, around 10% of his total walk time, more than 250m away from his owner over a 4.5 hour total walk time. If we look at his graphs below you can see that he consistently goes on his little ‘adventures’ on each walk. Unfortunately for his owner sometime his recall isn’t on point resulting in him chilling out in the local vets!

Most unlike their sibling
An odd title for an award however despite being siblings Apollo and Blijke show very different walking habits with Apollo (the boy) showing far more ‘adventurous’ tendencies than his more ‘loyal’ sister Blijke. Apollo’s max distance throughout the week is 156 metres with an average deviation distance of 34m. If we compare this to Blijke, her max distance is 125m with an average deviation of 10m which is pretty low. The image below attempts to visualise this a little clearer, the blue graph represents Apollo and the orange Blijke

Most likely to espace
This is a tricky award as two of the dogs I have tracked, Desmond and my own dog Bryn have both escaped! However I am awarding this to Bryn as his max distance, 664m, is considerably higher than any other dog I have tracked — I am putting that down to him still being young!

Did not finish (DNF)
The last award goes to a dog I am yet to mention, Fifi a young Cavachon, who absolutely refused to have a tracker strapped to her. We had to cancel the tracking as she was refusing to walk with it! So as a special thanks for taking part here is Fifi…

Plotmypaws Phase 2 continues, with new dogs being added to the list I am confident that by Christmas I will have tracked a good portion of the village dogs! The next phase will be to expand in geographical coverage and ask for a wider participation, if you are interested in helping a growing project contact info@plotmypaws.com or tweet me @craigtaylorviz.
Special thanks to all my village contributors, I owe many a pint and glass of prosecco at the local pub and big thanks to Ito World (www.itoworld.com) the company I work at, for making such great visualisation tools!
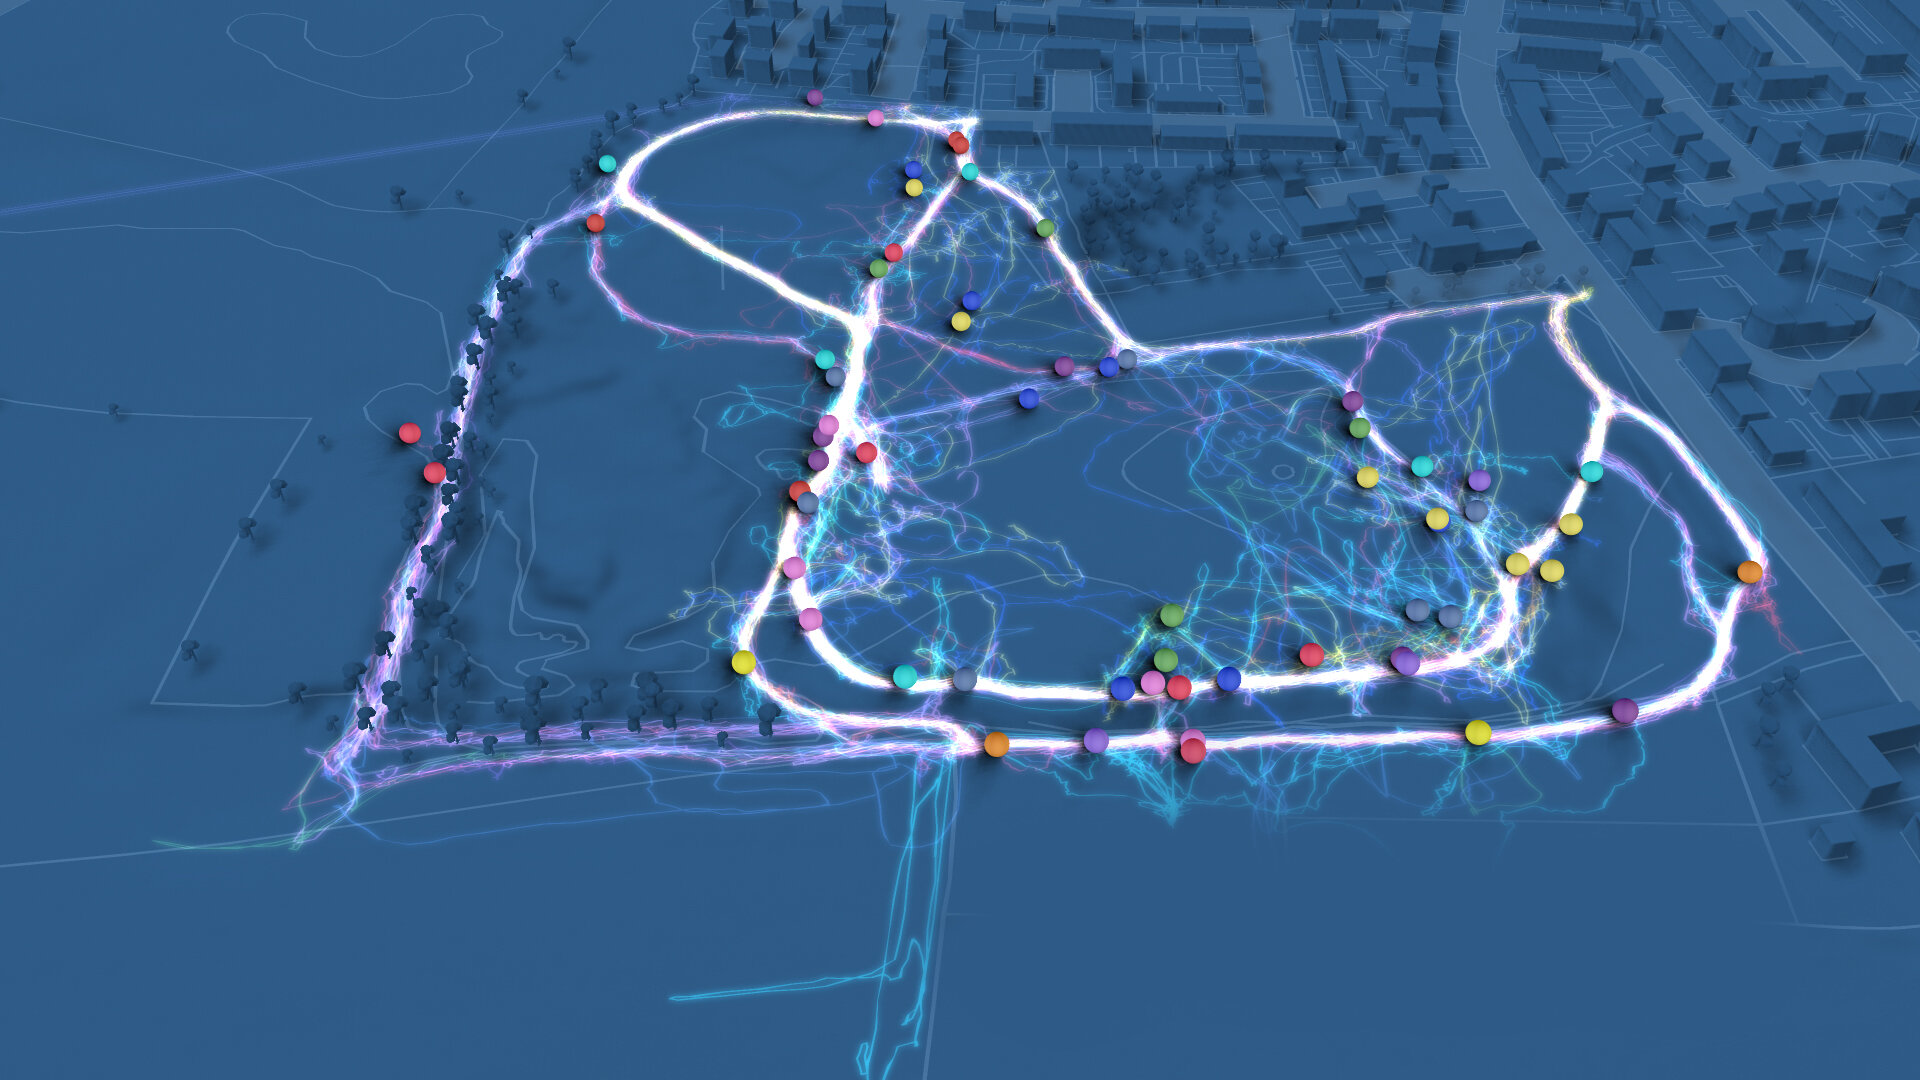
As a leaving gift and something a little different, I experimented with a different kind of data-visualisation, a cosmic foray into mapping GPX points of all the dogs in the field. Enjoy!