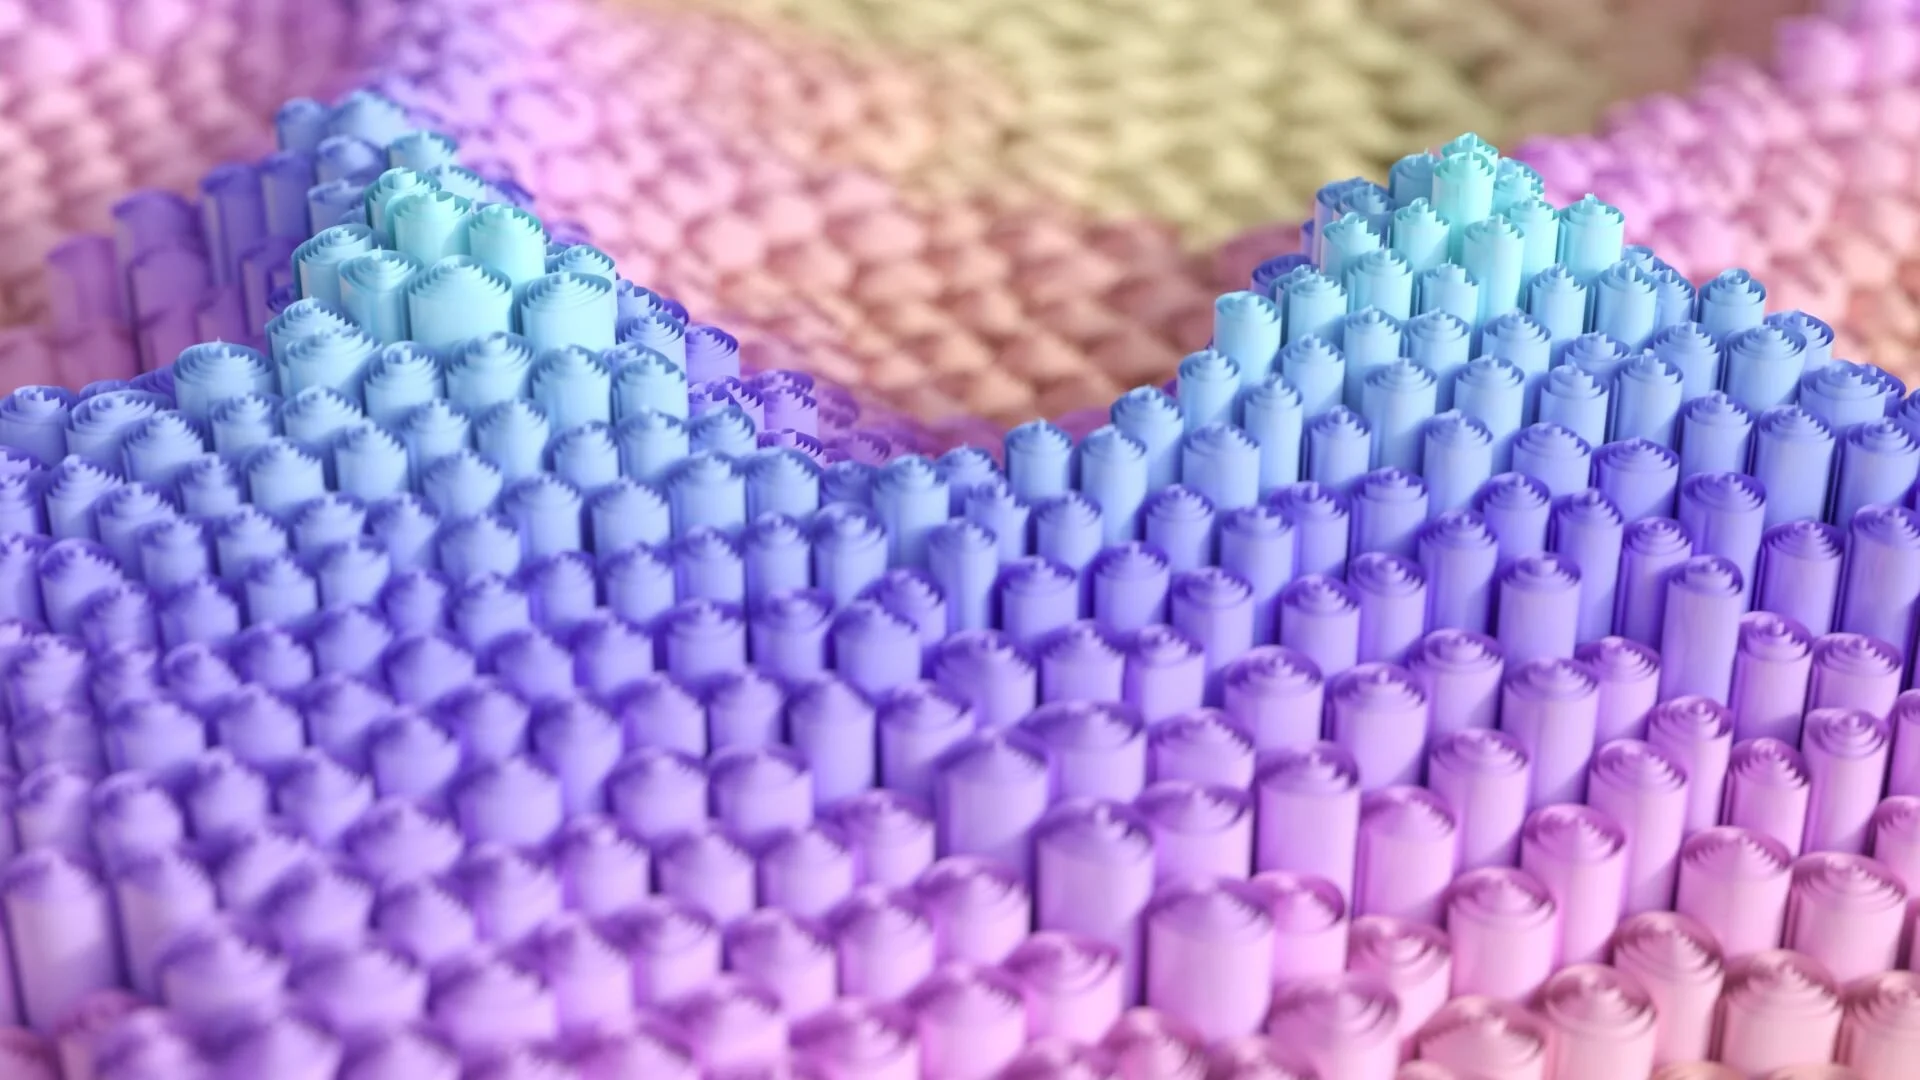
Random Experiments
LegoViz
2021 started with an idea from a Christmas present my wife gifted me. To me, Christmas isn’t Christmas without Lego, so having the original Nintendo Entertainment System to build over the festive period was pure bliss for me! It wasn’t long before I turned it into a data visualisation… I didn have plans to do a whoel series of these but never got round to it. Perhaps I’ll get a Mega Drive as Lego this Christmas to build into a dataviz!
Terrain Experiments
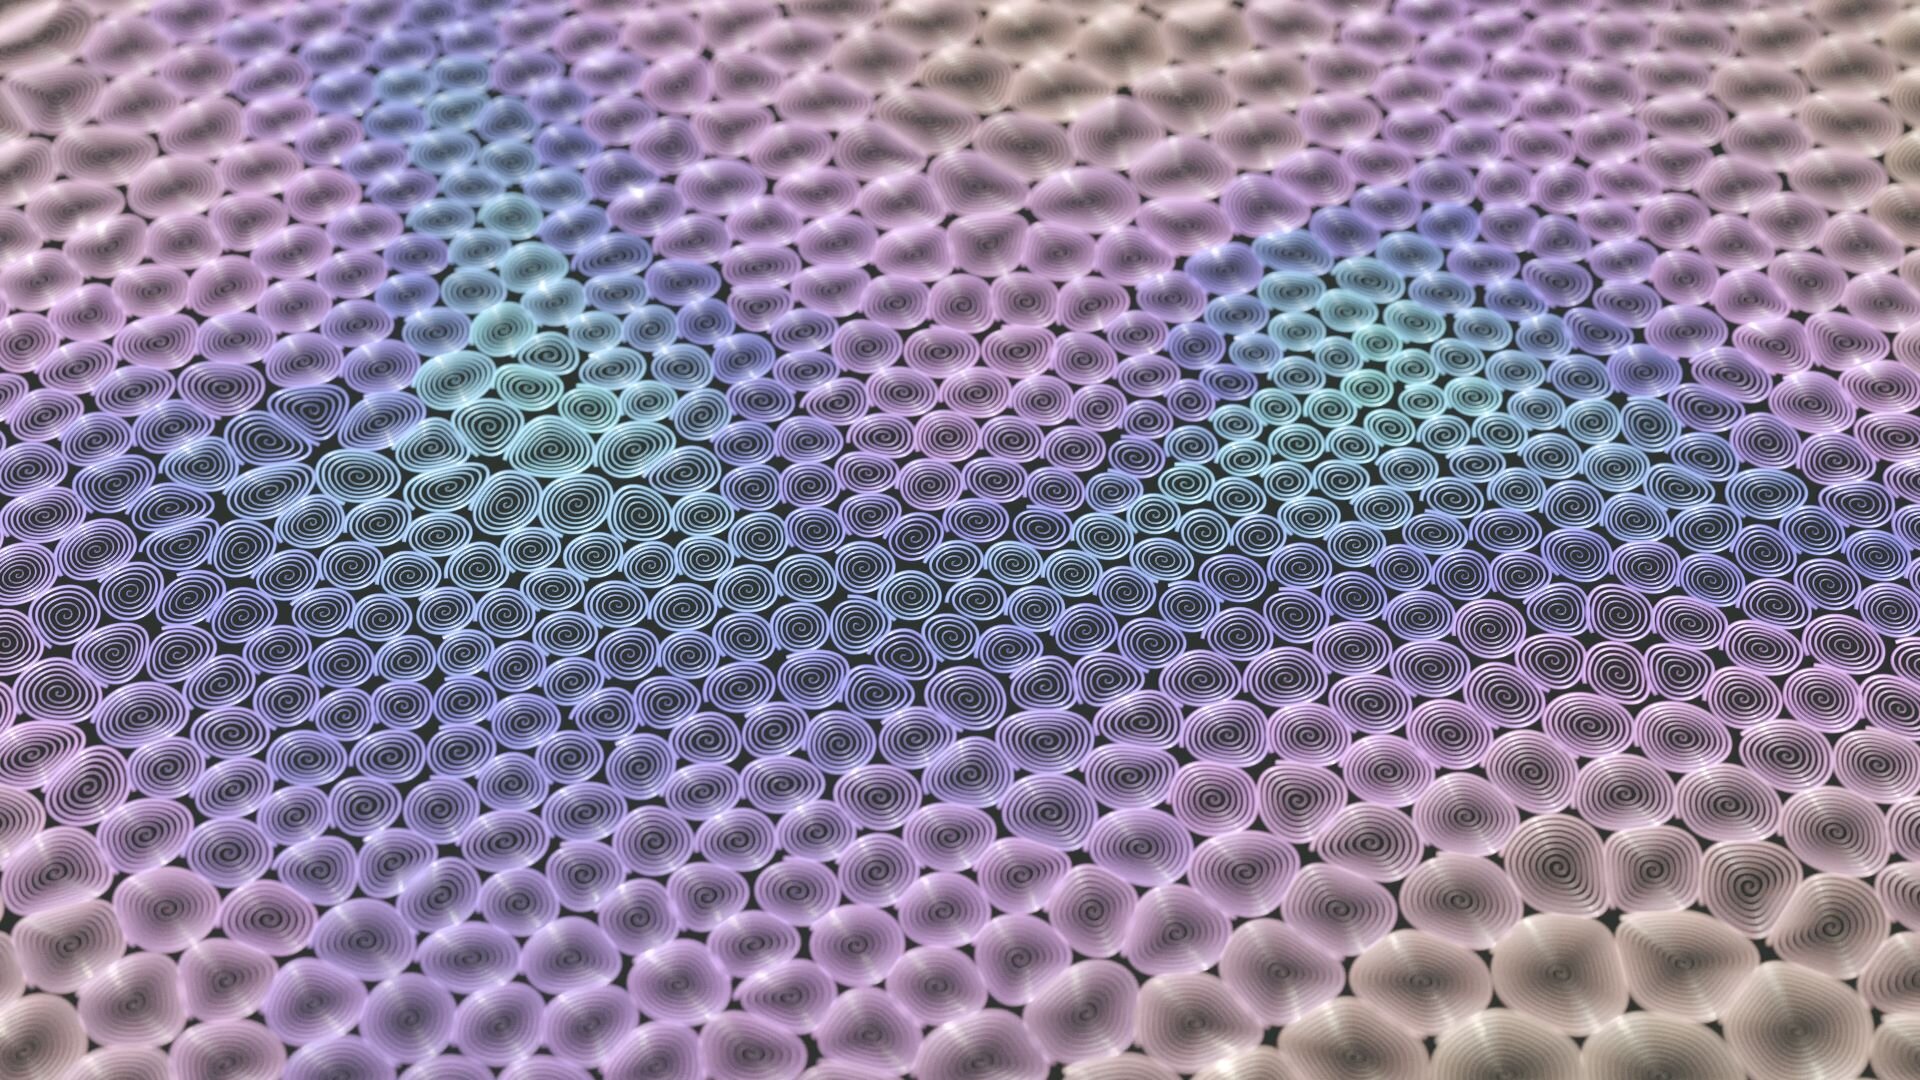
I’m always using terrain as a base for experiments, so here are a few concepts I’ve worked on this year. The first being quilling, Entagma have a great tutorial on procedural modelling which is where I got the inspiration from!

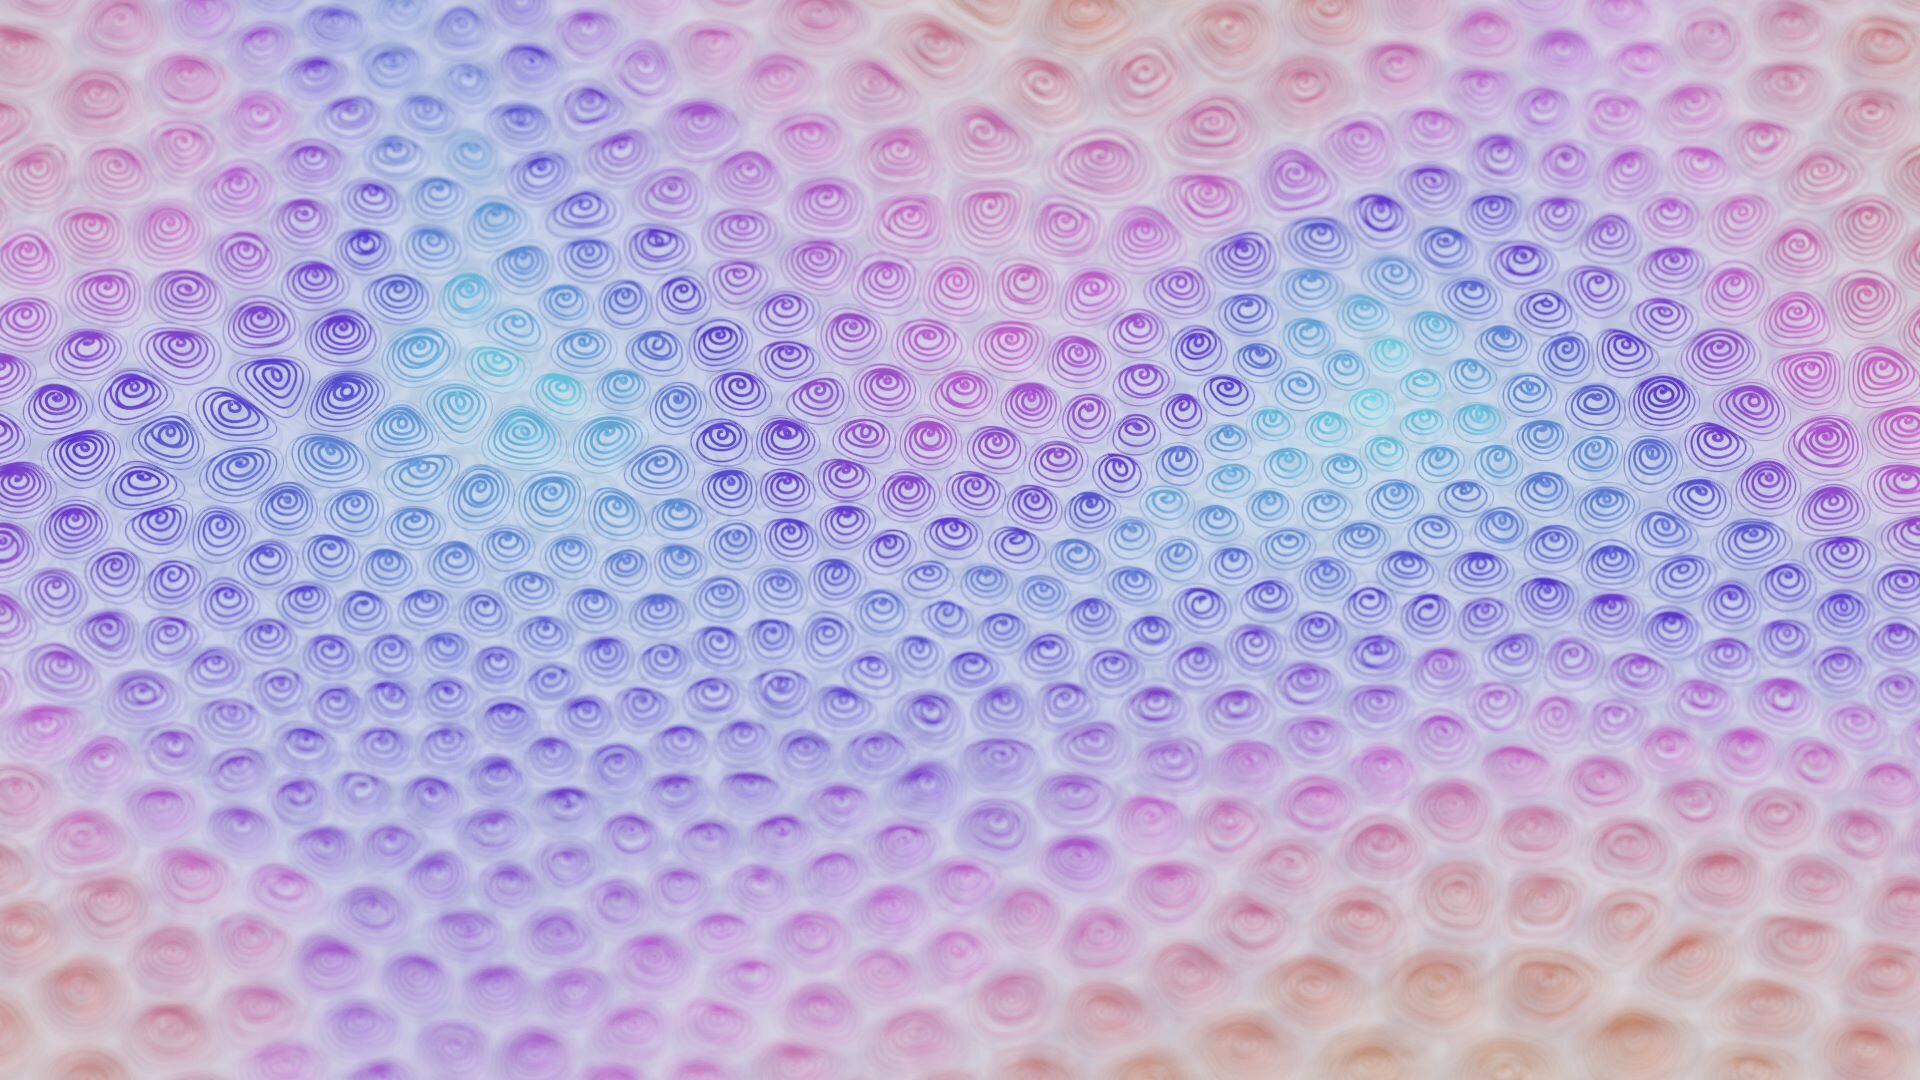
I was also pretty interested in how to turn sprites into some sort of mapping earlier in the year and this great tutorial from Lester Banks helped me apply it to terrain - turned out to be a pretty neat concept.
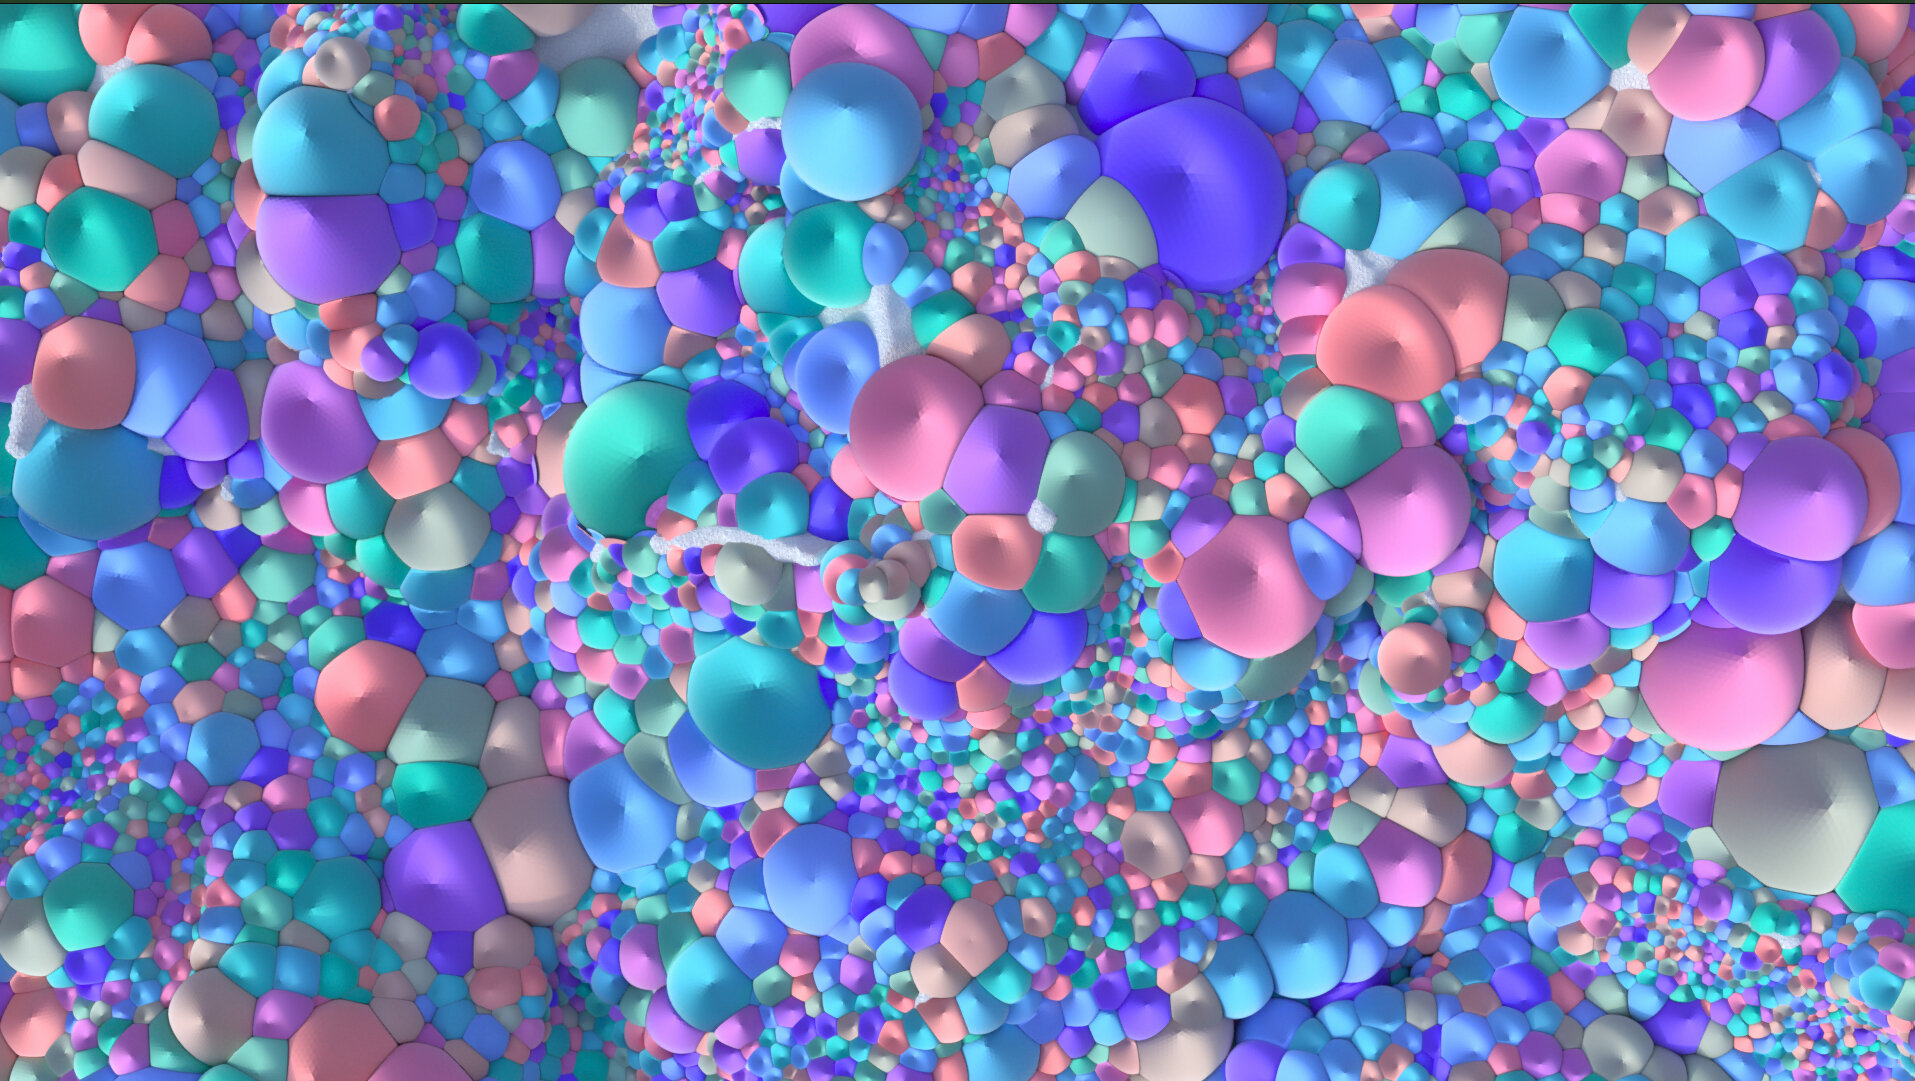
Deforming Data
A lot, most, all(!), of my visualisations of transit data revolve around animating spheres as proxies for buses or cars ets. The abstract nature of these visualisations means that a lot of the time the spheres are orders of magnitude bigger than their real-life counterparts. This means there is always overlap in geometry which is usually fine but it got me thinking, what if the spheres interacted with each other and reacted when they overlapped.
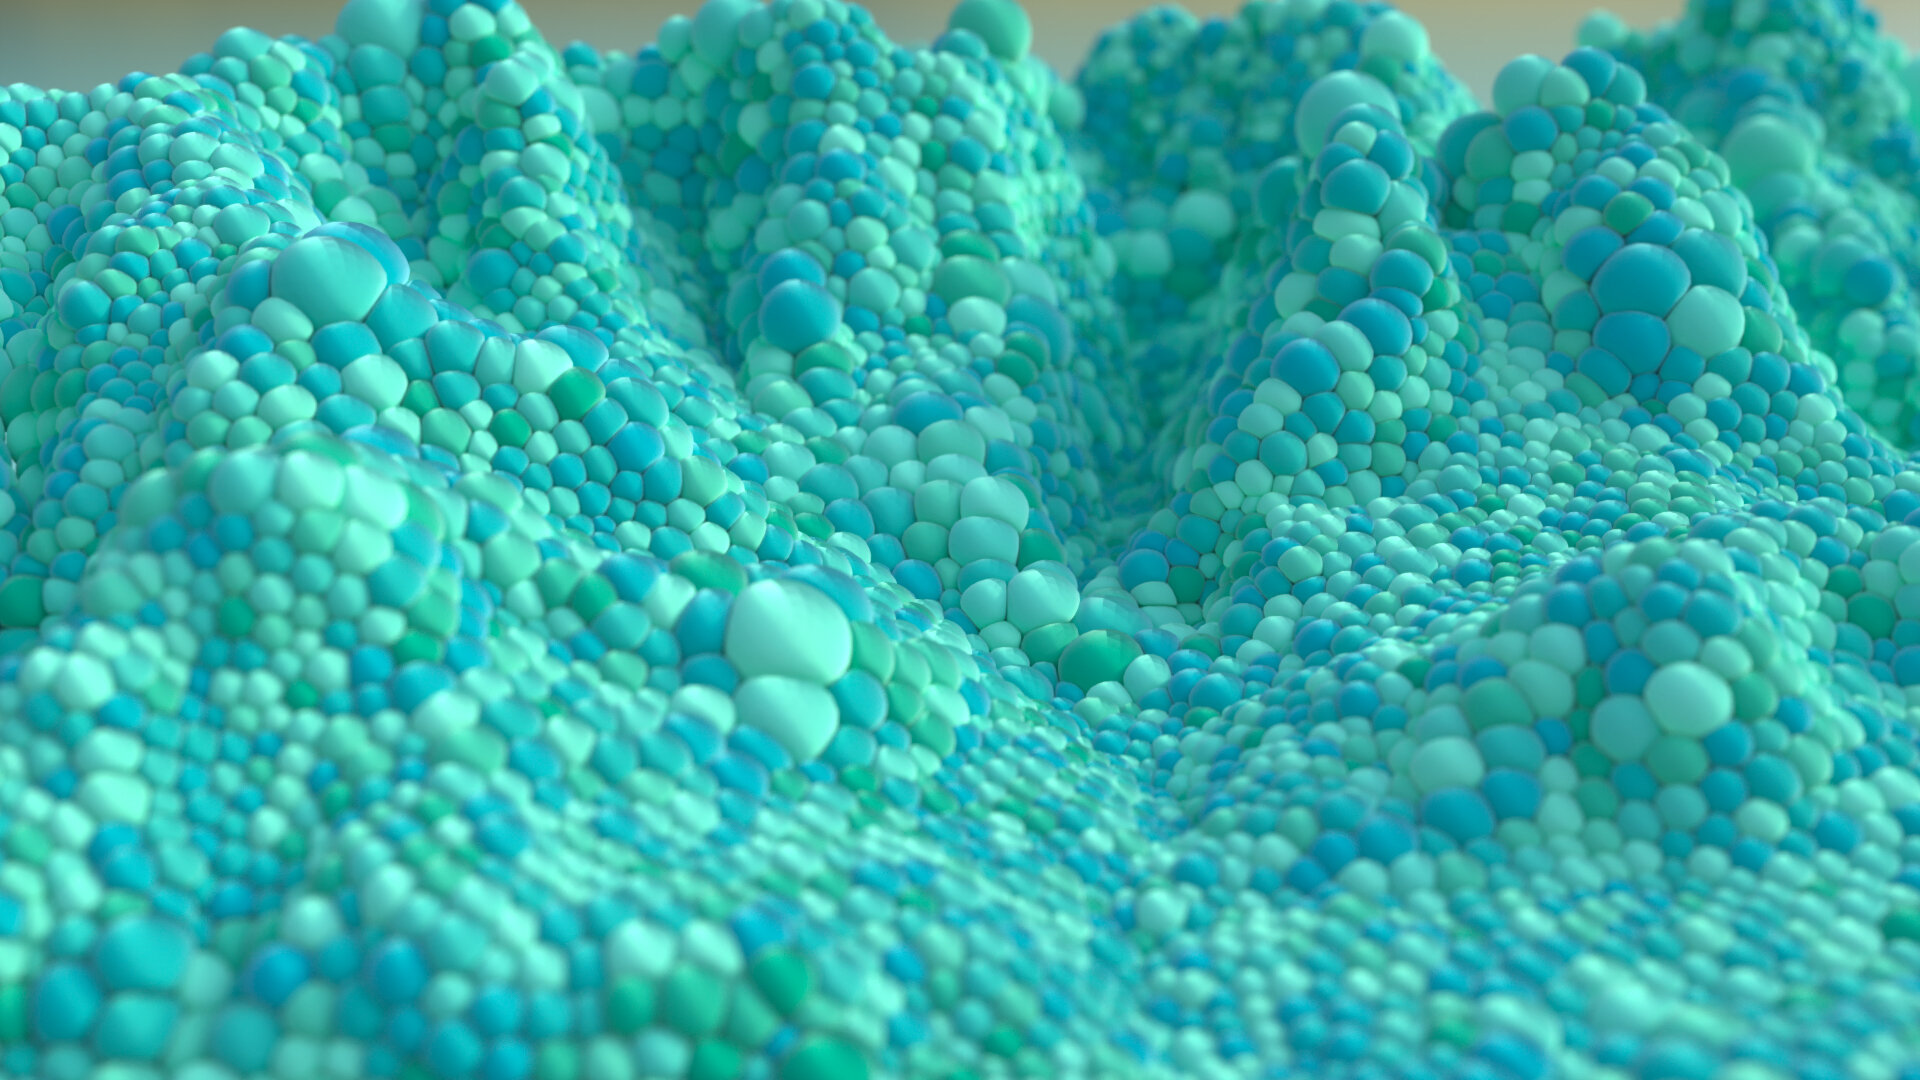
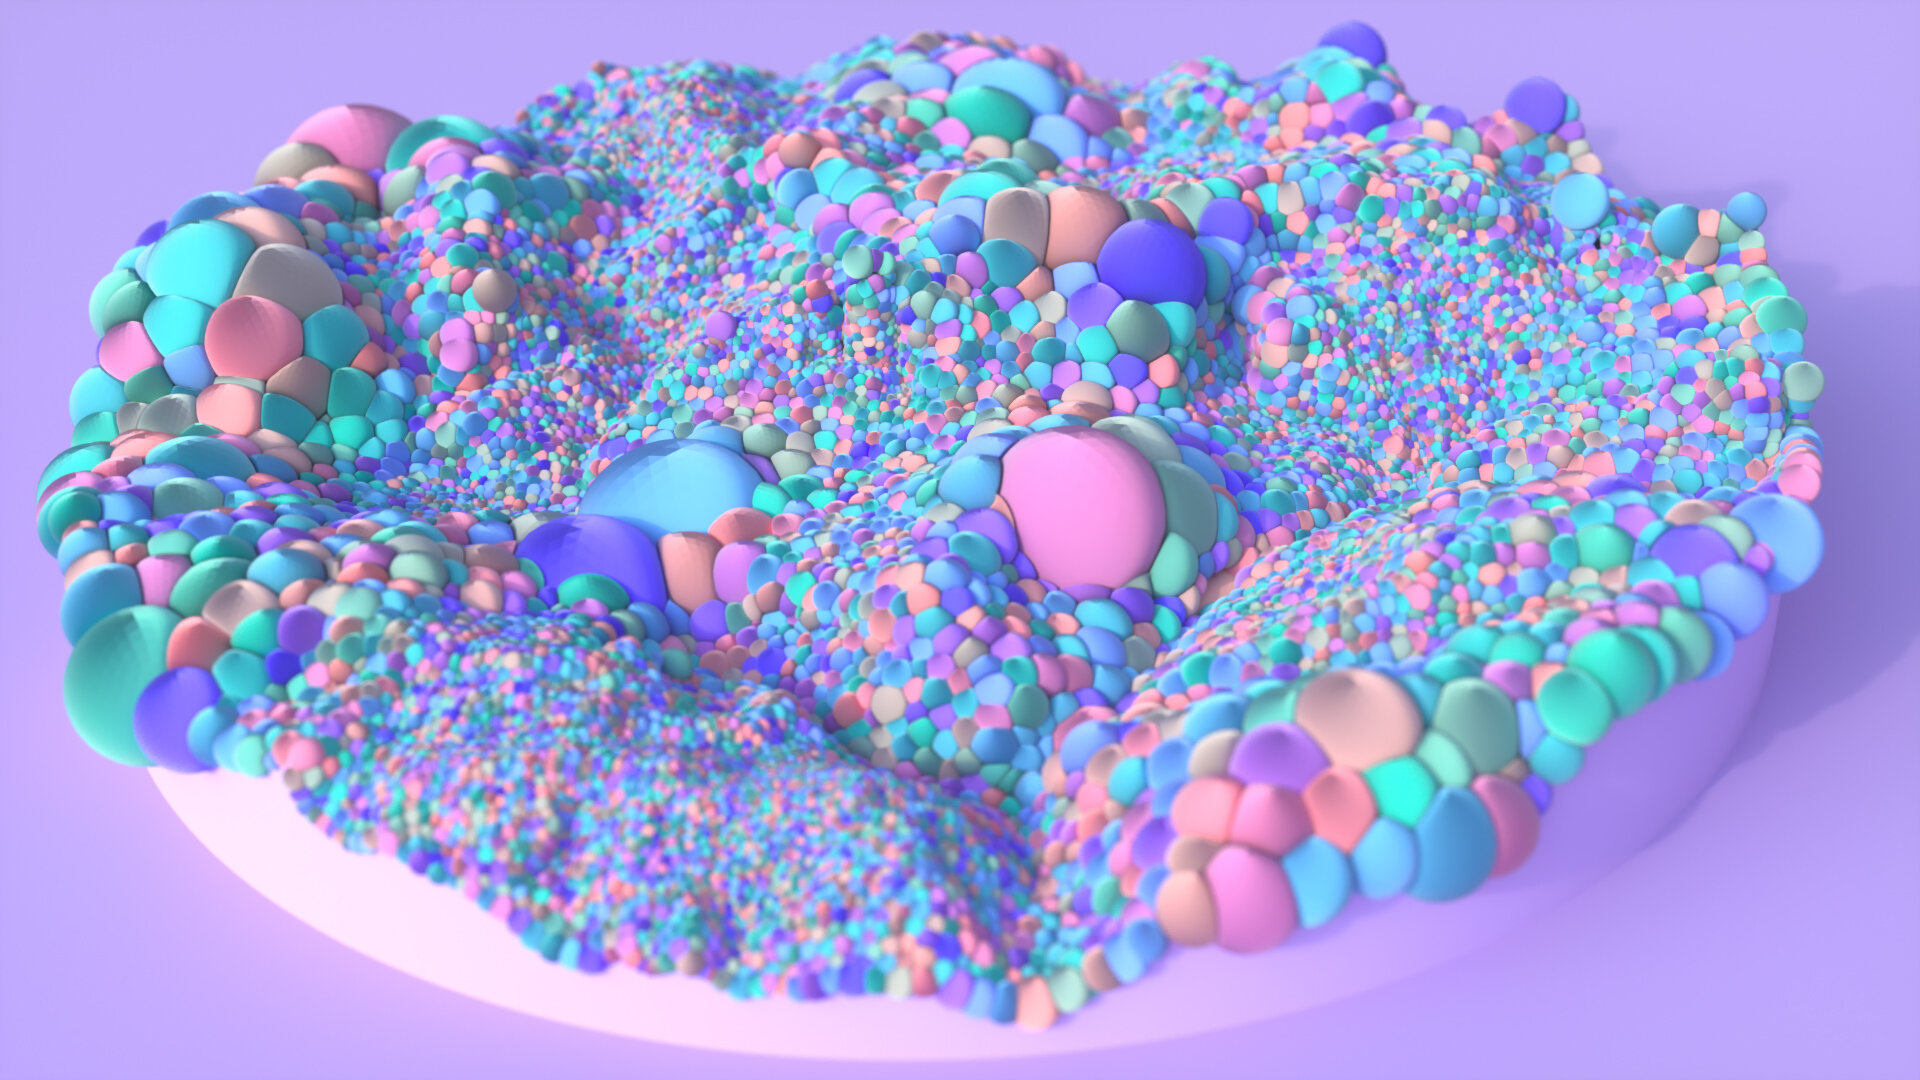
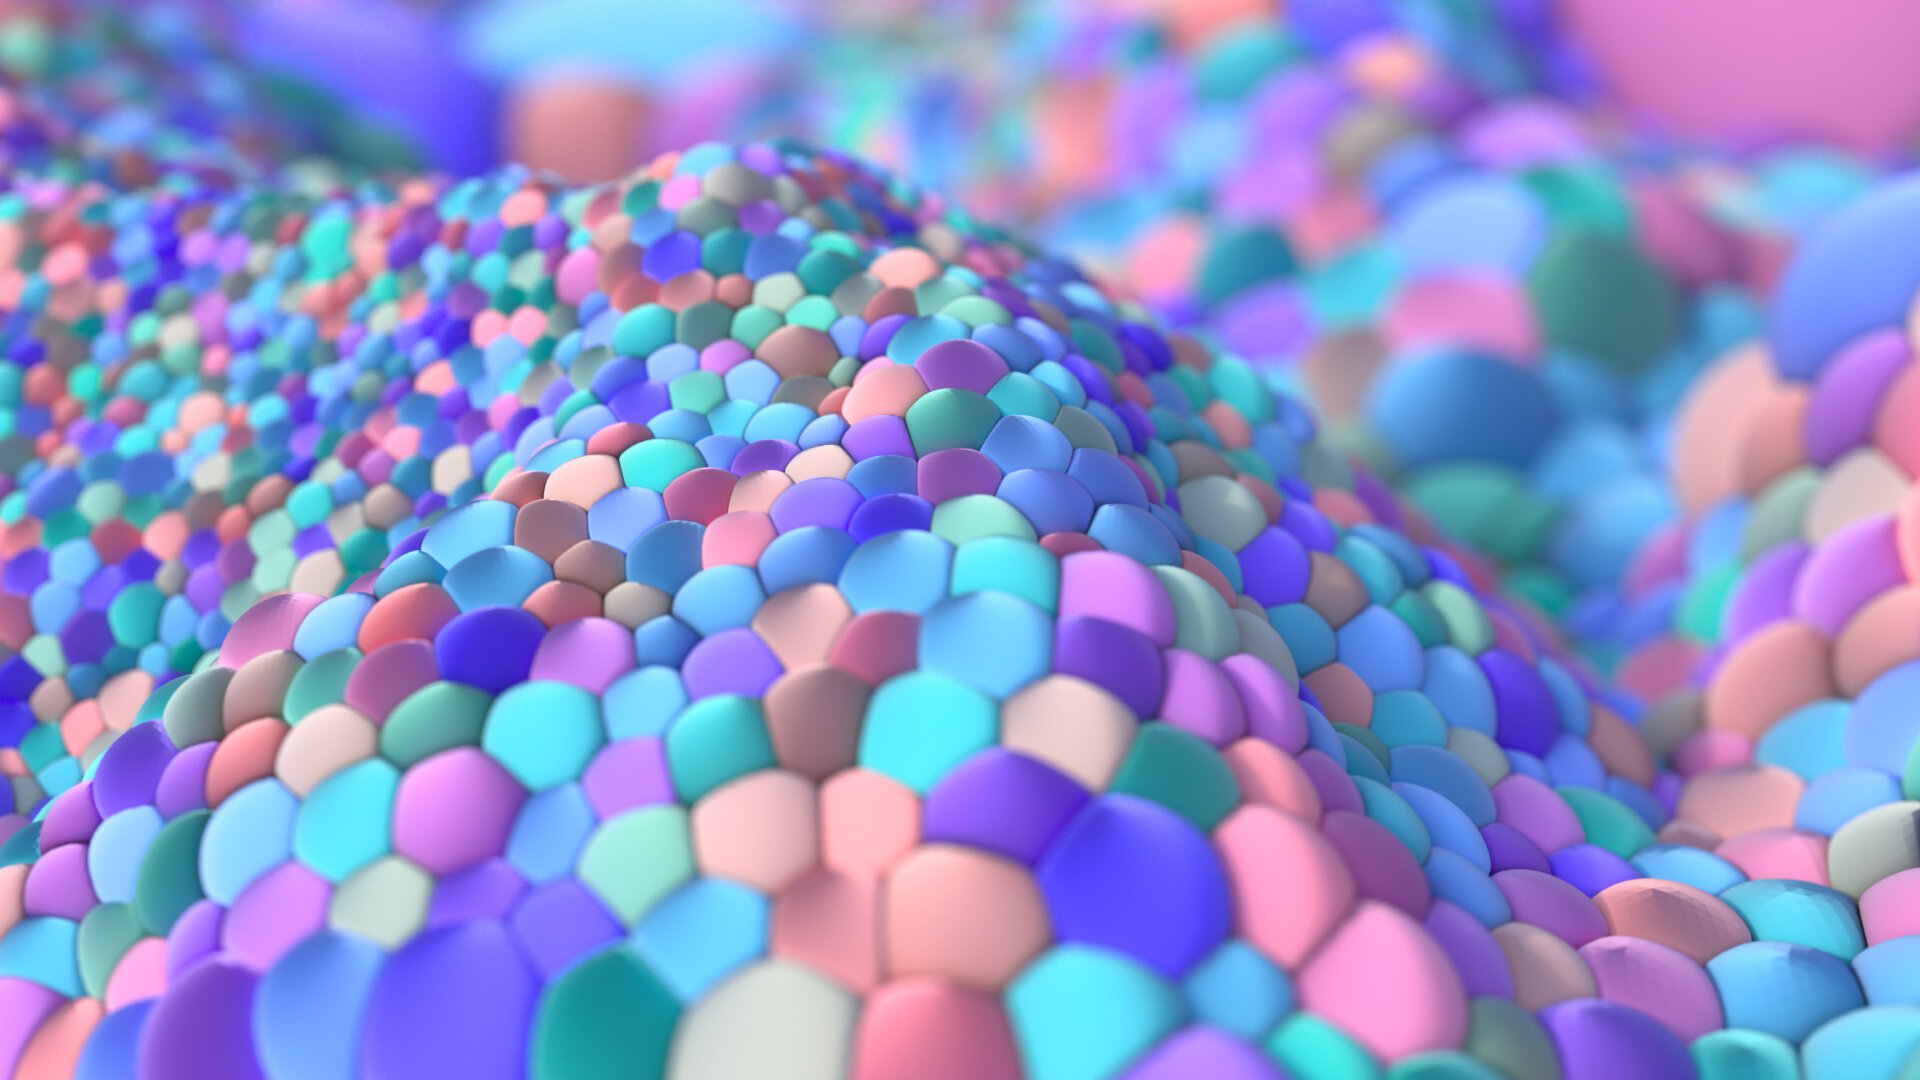
I spent a fair bit of time researching how to deform geometry based on proximity, as always it turned out Entagma had a solution to this here - applying this to transit data made for some really lovely results…
I also ended up applying this technique to static data - terrain data obviously!