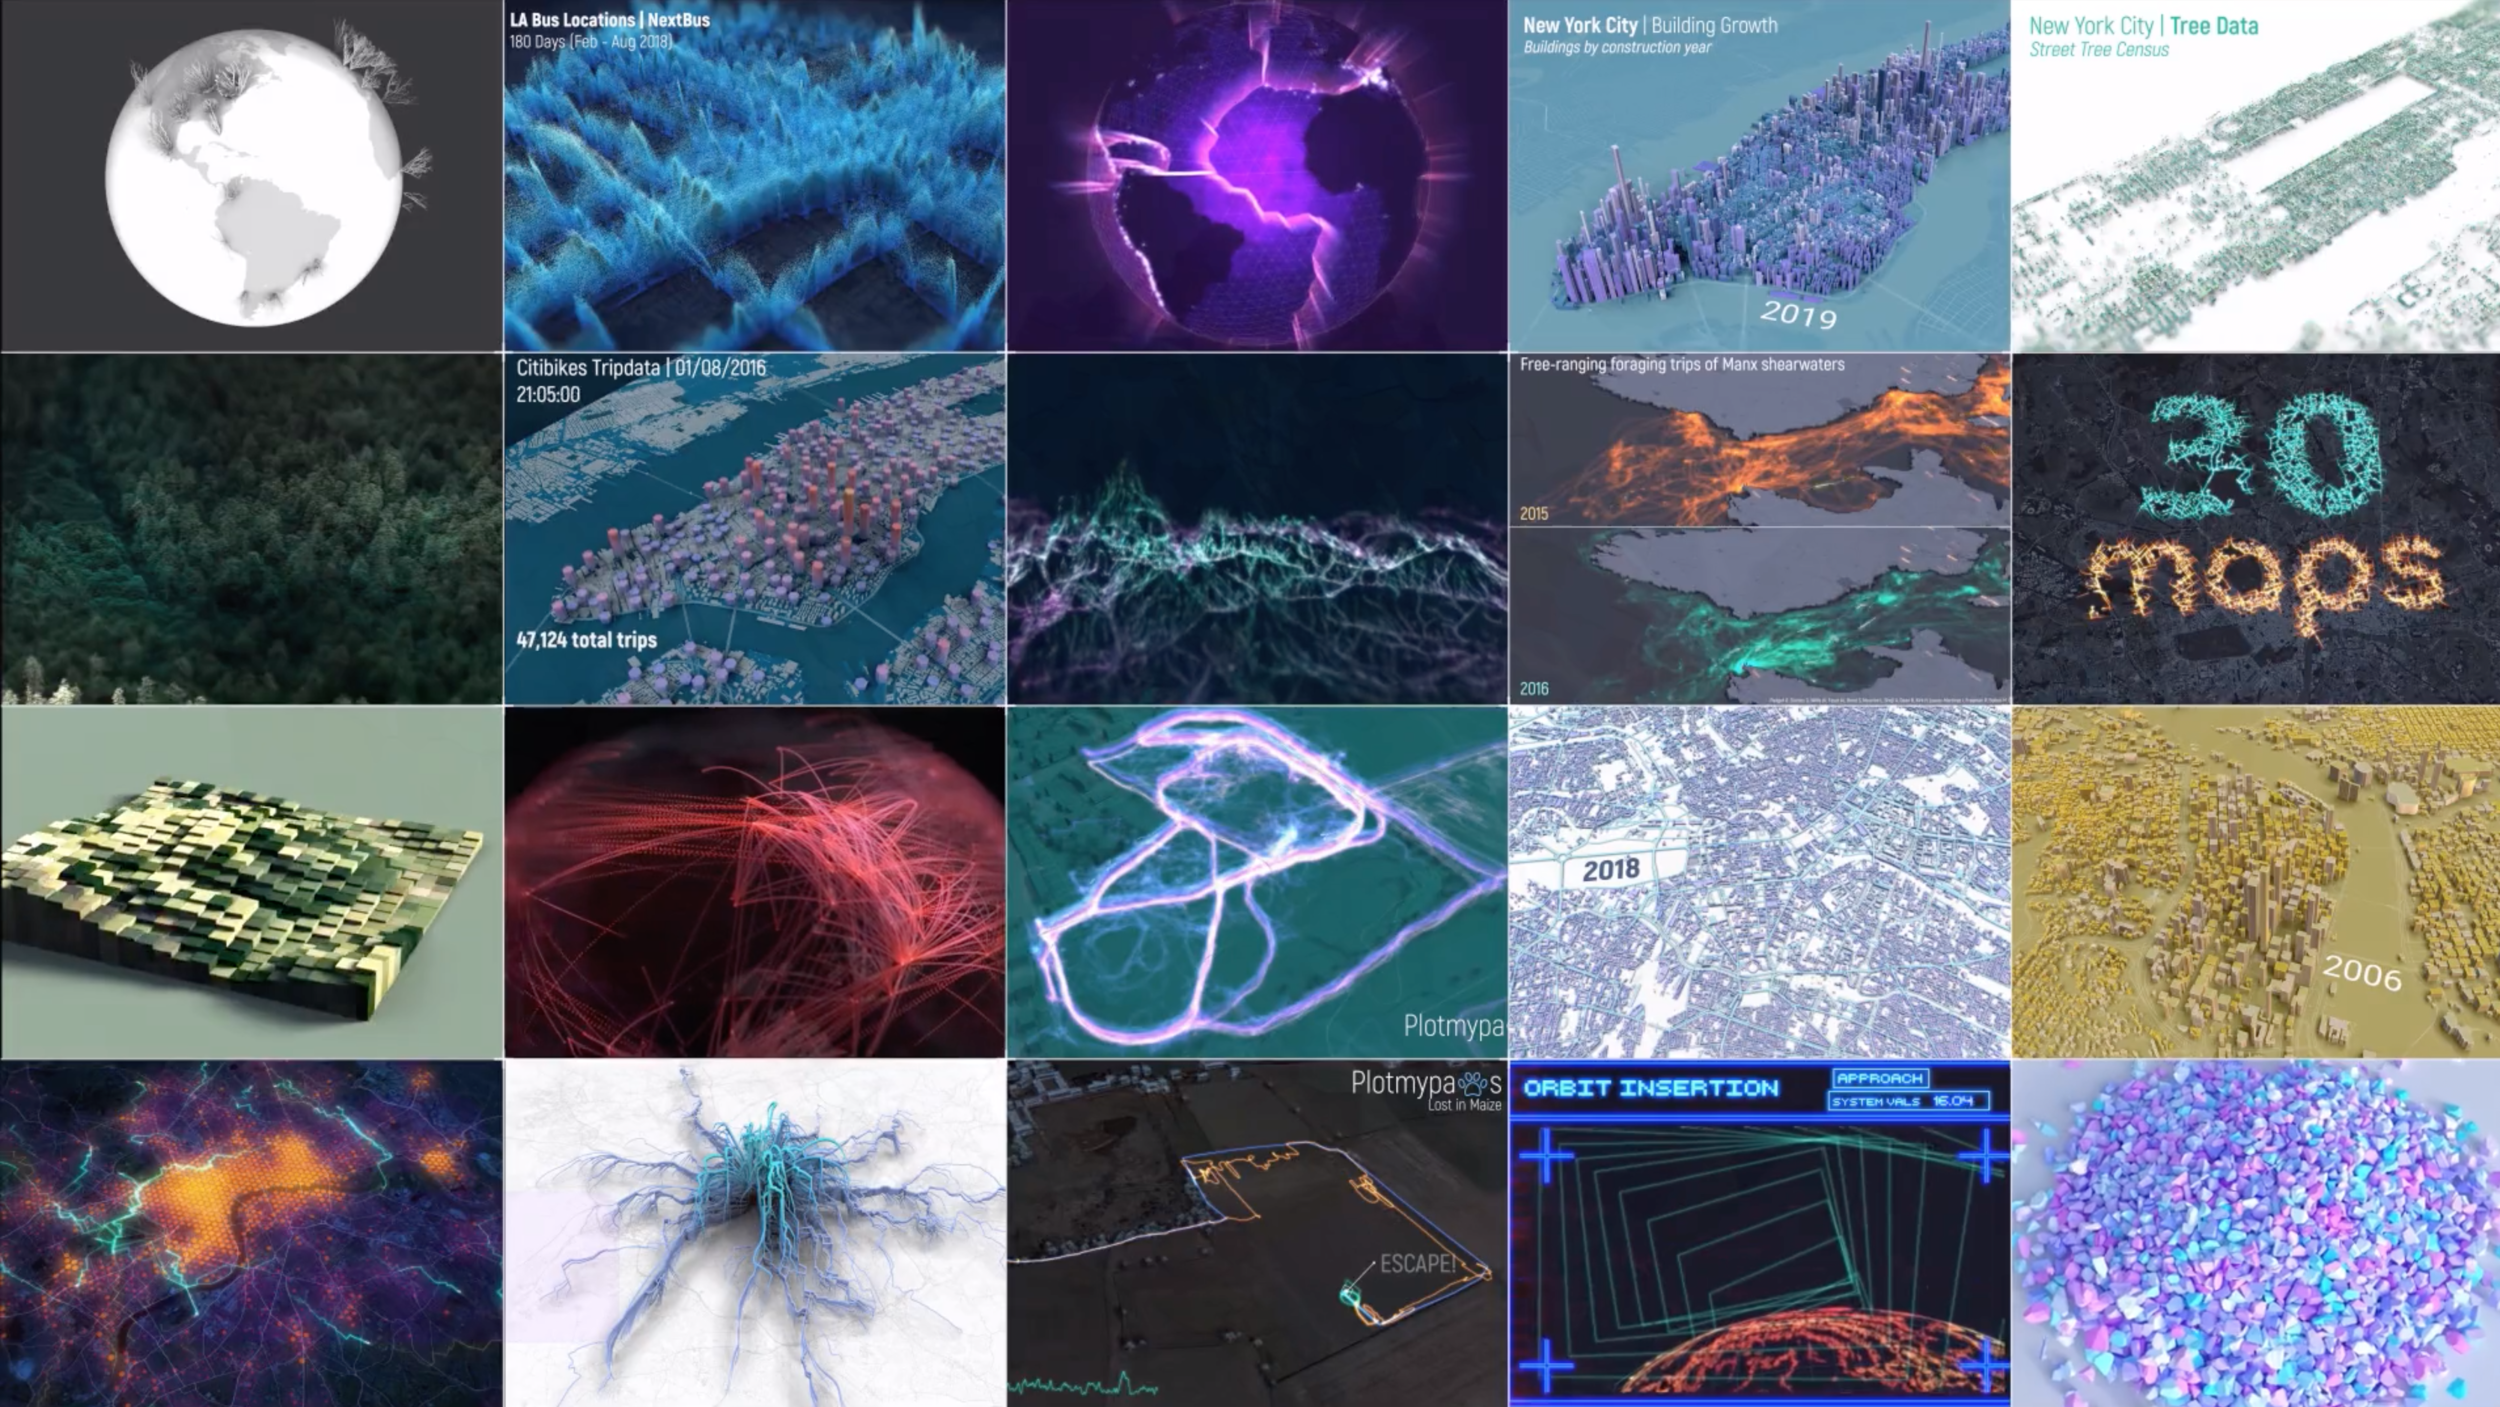
#30DayMapChallenge
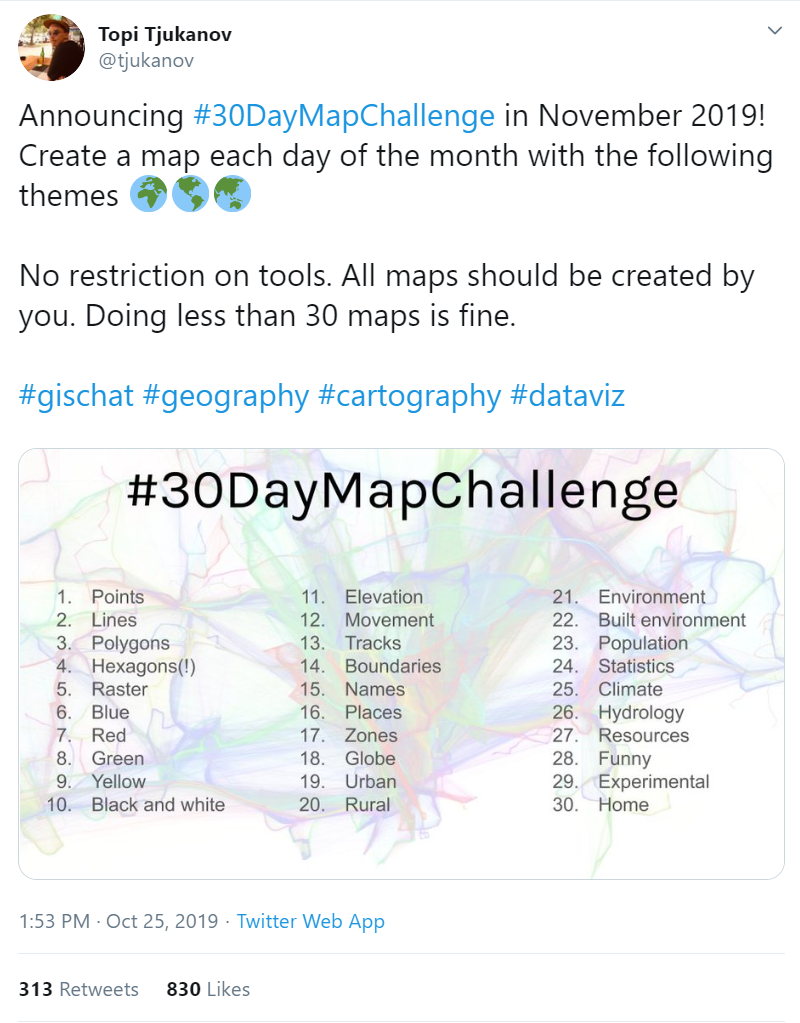
I tend to share quite a lot of my concept visualisations and experiments on Twitter and after seeing Topi’s challenge I couldn’t resist to give it a go.
Working in geo-animation I wanted to create an animated snippet everyday, which is a little trickier than I envisaged. I have a huge library of styles and templates set up but I wanted to use new data everyday so I wasn’t just re-posting content I had created earlier.
All animated content was created through our Ito World software with some exceptions for the terrain deformation project which is made in Cinema4D. Render times are generally pretty good but I worked a day in hand so I was able to use the previous night to render and post in the morning of the challenge day.
It was a fun and challenging process - mostly to try and be creative everyday! I certainly have a new found appreciation for folk who post ‘dailys’ like Beeple!
Day 3 Polygons:
This was part of an ongoing project in terrain deformation using voronoi polygons in Cinema4D. I thought I could tag it for ‘day 3’ of the challenge!
Day 4: Hexagons:
Citibike trip data binned into hex pillars by finish position and pivoted into hourly blocks by stop time for New York.
Data via: https://data.world/citibikenyc/citibike-tripdata-august-2016
Day 5: Raster
This fun little voxel generator uses an elevation raster to derive height and an aerial raster to colour the voxels accordingly. Cell size is tweaked halfway through.
Day 6: Blue
25 million bus locations for #LA recorded over 180 days last year from NextBus.... in blue!
This also makes up for my missing 'Day 1: Points' post. The height of point is indicative of the speed at the time of recording.
Day 7: Red
Global flight paths... In red.
I didn't have too much time this morning. This is a bit more experimental, playing around with point focus and depth of field.
Day 8: Green
Animated swathe of lidar from the Willamette National Forest Lidar (Aug 2008)
Data via: https://opentopography.org
Day 9: Yellow
Animated growth of buildings in #Portland, Oregon... in yellow.
Admittedly a tenuous link to 'yellow'. It’s important to note the order of buildings growing is linked to the ‘construction year’ of all current buildings.
Data from http://gis-pdx.opendata.arcgis.com
Day 10: Black and White
Here is an ambient occlusion / monochrome version of my recent Halloween side project Cosmic Corals.
Each Coral represents huge drive time catchments in the world's most populated cities.
Day 11: Elevation
Full disclosure - this wasn't made on the day but is something I was working on before the challenge started and I finished it recently. Here is the cinematic version of my experiments in 'Terrain Deformation' with music
Day 12: Movement
Today's challenge data comes from the awesome @MovebankTeam, an amazing resource for animal tracking data.
This dataviz is showing the movement of Manx shearwaters around the coast of Wales, Isle of Man and Ireland.
Day 13: Tracks
There was only one dataset I was going to use for 'tracks' and that's from my PlotMyPaws project.
I tracked over 100 dog walks in my local conservation area to see the patterns different dogs take!
Day 14: Boundaries
I had a lack of creative inspiration with thinking of how to animate 'boundaries'. So here is a rotating globe with tectonic plates as light flares and tsunami locations highlighted.
Data via: https://www.ngdc.noaa.gov/hazard/tsu_db.shtml
Day 15: Names
I decided to take a break from the awesome challenge for a few days so ended with this 'name' tribute to @tjukanov's idea. I've had a ton of fun and have lots more ideas but little time to do them justice!
Day 18: Globe
Does anyone remember the brief landing sequence on LV 426 from one of the greatest sci-fi films ever - Alien?
Well, I tried to recreate it for today's 'Globe' challenge!
Day 19: Urban
A quick animation of the evolution of @openstreetmap in Berlin for all the v1 additions of roads and buildings.
Building height is random - I didn't have time to extract actual values.
Day 21: Environment
Experimental animation of all the trees in NYC ... raining from the sky. Sorted by date they were added to the dataset.
Data via: https://data.cityofnewyork.us/Environment/2015-Street-Tree-Census-Tree-Data/uvpi-gqnh
Day 22: Built Environment
Same idea as 'yellow' and another NYC dataviz (!) but it looks cool! This viz shows the historic construction date of all current Manhattan buildings. *Height exaggerated*
Data via: https://data.cityofnewyork.us/Housing-Development/Building-Footprints/nqwf-w8eh
Day 26: Hydrology
All the rivers of Wales interpolated by their exaggerated terrain height. Such a challenge to get these gifs under 15mb, this looked a lot better as a video.
Data via: https://www.ordnancesurvey.co.uk/business-government/products/open-map-rivers
Day 28: Funny
Lost in Maize! This isn't new but looking back was pretty funny (not at the time!)
Here is a quick visualisation of what happened when my dog Bryn got lost in a maize field.
Day 29: Experimental
Every dataviz I produce stems from experimenting - this old concept looked at optimising journeys around London to avoid population hot spots. The population heatmap change is fabricated for testing purposes.
Day 30: Home
This last one is a bit weird! Animated dataviz of origin-destination commuter flows (census data) into Manchester (closest to home) routed via OSM and made into arcs!
What a fun month!
Wrapup
Well, I didn't hit the 30 but here is a showreel of all of my animated maps. https://vimeo.com/376676036 Old concepts but new vizzes every day was a blast to do! I'm taking a break from twitter for so see you all next year!